
Documentation menu
Integrations
Monitoring sources, clouds, hypervisors and notifications
OrcaMonitor is designed to sit on top of what you already run, so the integration story is mostly about reading from existing systems rather than replacing them. Everything is configured in Settings, and each integration is independent: none of them is a prerequisite for another.
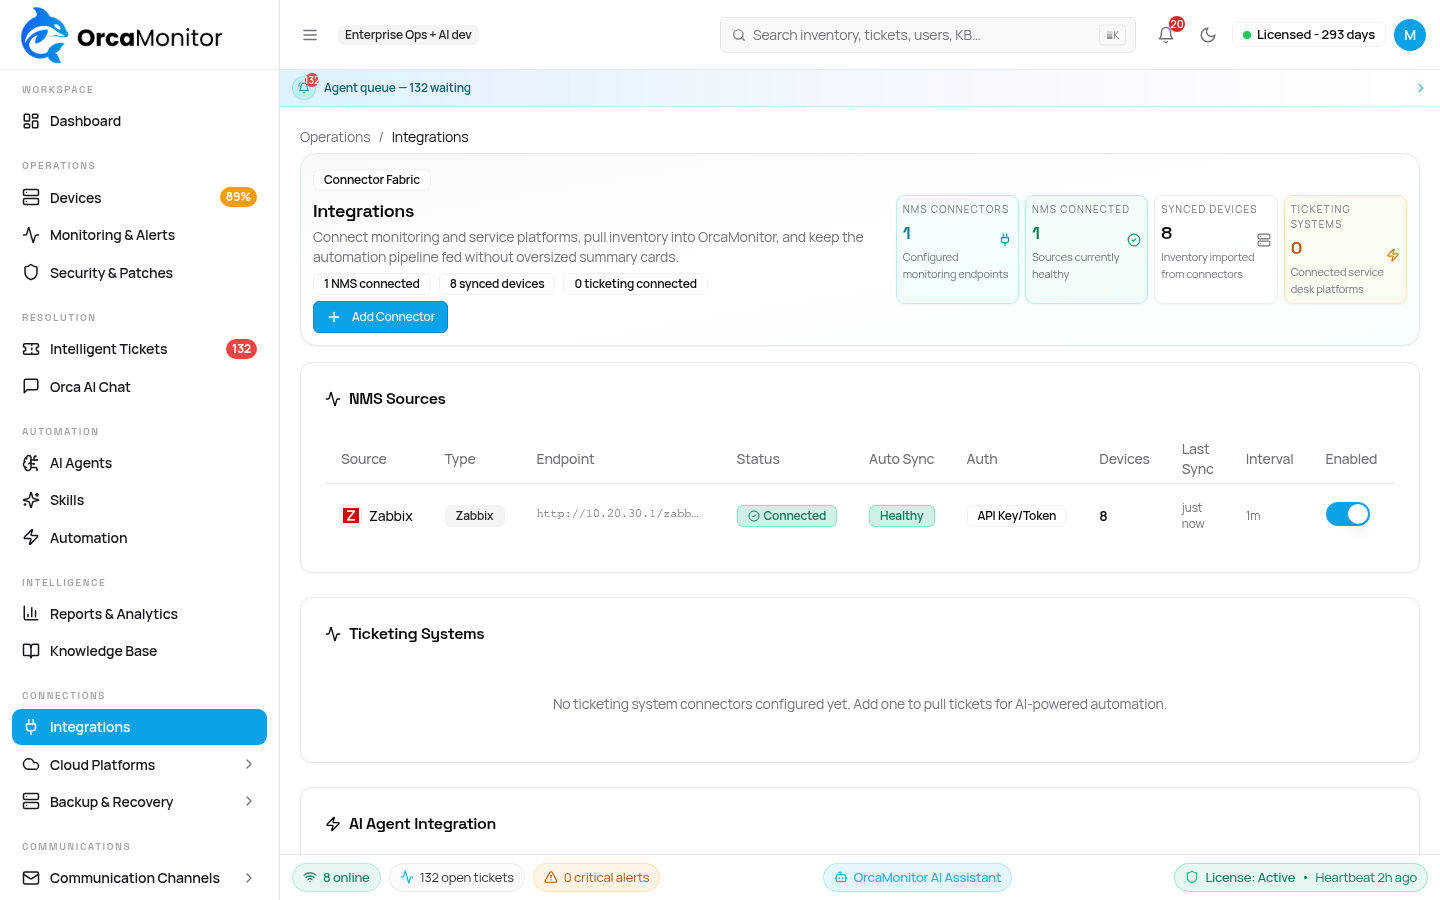
An integration only contributes tools and data once it is configured. Until then its agent tools are deliberately not advertised, so the assistant behaves as if that platform does not exist — which is correct, and also why "the agent says it has no Meraki tools" usually means the key is missing rather than anything being broken.
Monitoring sources
These are what turn detection into incidents. Each is configured with credentials OrcaMonitor can read from, and each can contribute devices to the inventory in addition to alerts.
Zabbix
Two-way: alerts arrive by webhook, and the API sync pulls hosts into the inventory with enrichment. The SNMP community string is inherited from the Zabbix host configuration, so a device that already works in Zabbix does not need its monitoring credentials re-entered by hand. SNMPv3 credentials are detected without copying passphrases.
Both halves are configured from the connector's own panel in Integrations: the API credentials the sync reads with, the host groups and tags that select which hosts are pulled in, and the generated webhook URL that carries the alerts. The sync scope is the setting to check first when hosts are missing from the inventory but present in Zabbix.
- Inventory enrichment fills in Model and OS/version, which discovery alone often misses.
- Host groups and tags select which hosts sync.
- Webhook URL is generated per workspace and carries its own key.
LibreNMS, Nagios, PRTG, Splunk
Webhook-only sources. Each accepts the payload shape the tool natively sends, including the wrapped forms that some of them produce, so you do not need an intermediary to reshape the JSON.
| Source | Payload shapes accepted |
|---|---|
| LibreNMS | Wrapped and unwrapped |
| Nagios | Flat, and wrapped under data |
| PRTG | Flat, and wrapped under payload |
| Splunk | Flat |
Cloud platforms and hypervisors
These are inventory and control integrations: they keep the device list current and give the agent real actions on those platforms. Only some of them expose an alert or event surface — where they do not, the integration is inventory-only by design rather than unfinished.
| Platform | Devices come from | Alert surface |
|---|---|---|
| Cisco Meraki | Dashboard API | Yes — alerts can open tickets |
| Proxmox VE | Cluster API | No — inventory and actions only |
| VMware vSphere | vCenter API | No — inventory and actions only |
| UniFi Network | Network Integration API | No — the API exposes no event surface |
| Cisco ISE | ERS and Open API | No — endpoint and policy control |
| AWS / Azure / GCP | Provider APIs | No — inventory and actions only |
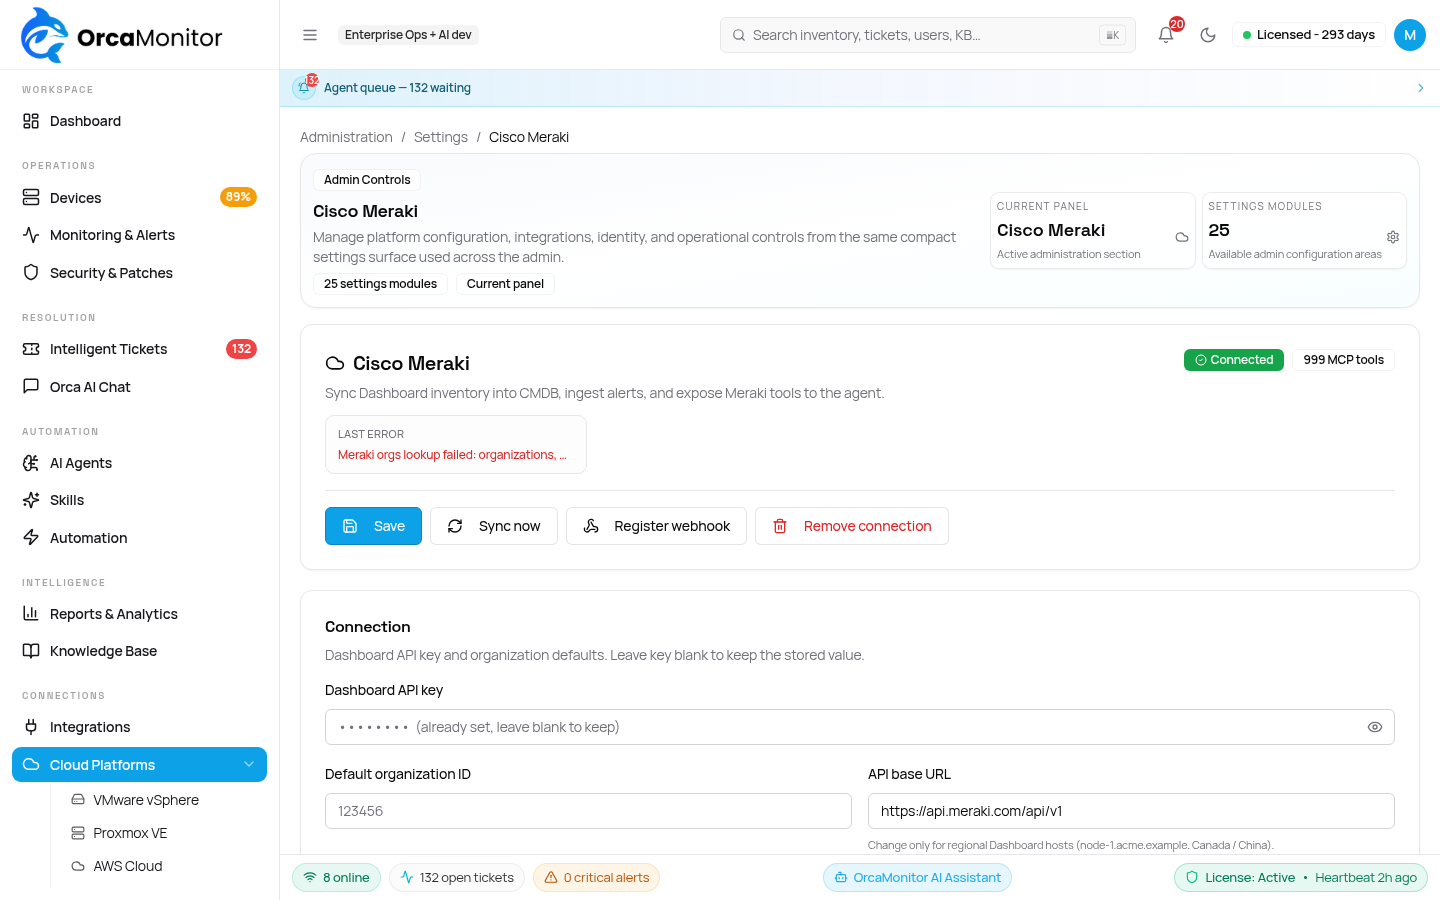
Cisco Meraki
The largest tool surface of any integration, because the catalog is generated from Meraki's published OpenAPI specification. Organizations and networks are discovered automatically; alerts can be enabled to open tickets.
Proxmox VE
Syncs nodes, virtual machines and containers. Guest status comes from the API, so a VM without a guest agent is not reported offline merely because its guest address is not routable from OrcaMonitor. Removing a VM in Proxmox removes it here on the next sync.
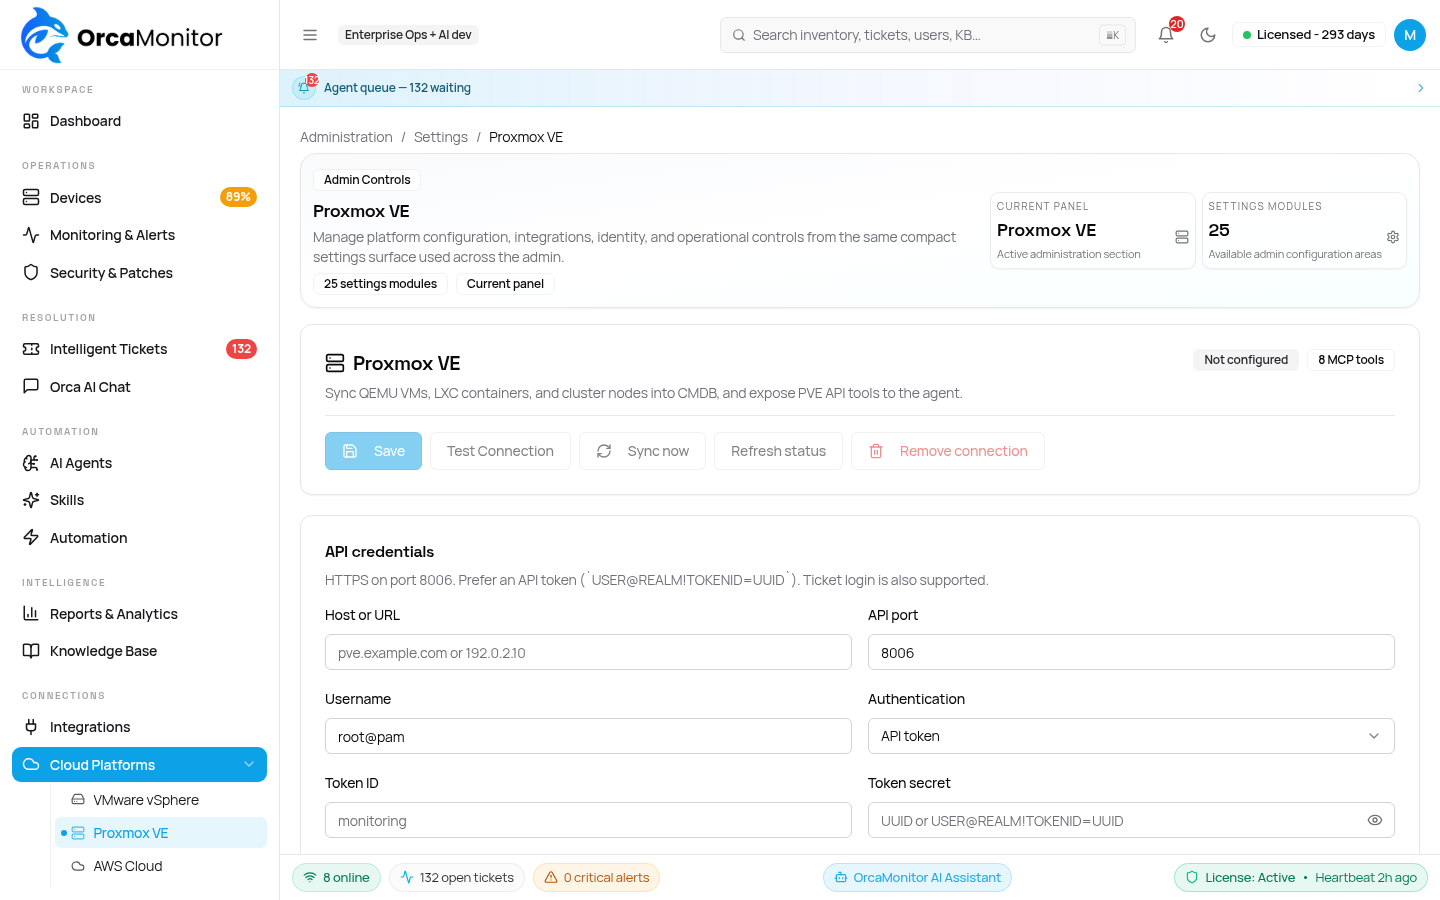
Without qemu-guest-agent, Proxmox reports a placeholder address and OrcaMonitor can only track power state. With it, the real guest IP is known and normal monitoring applies. The settings page lists which guests are missing it.
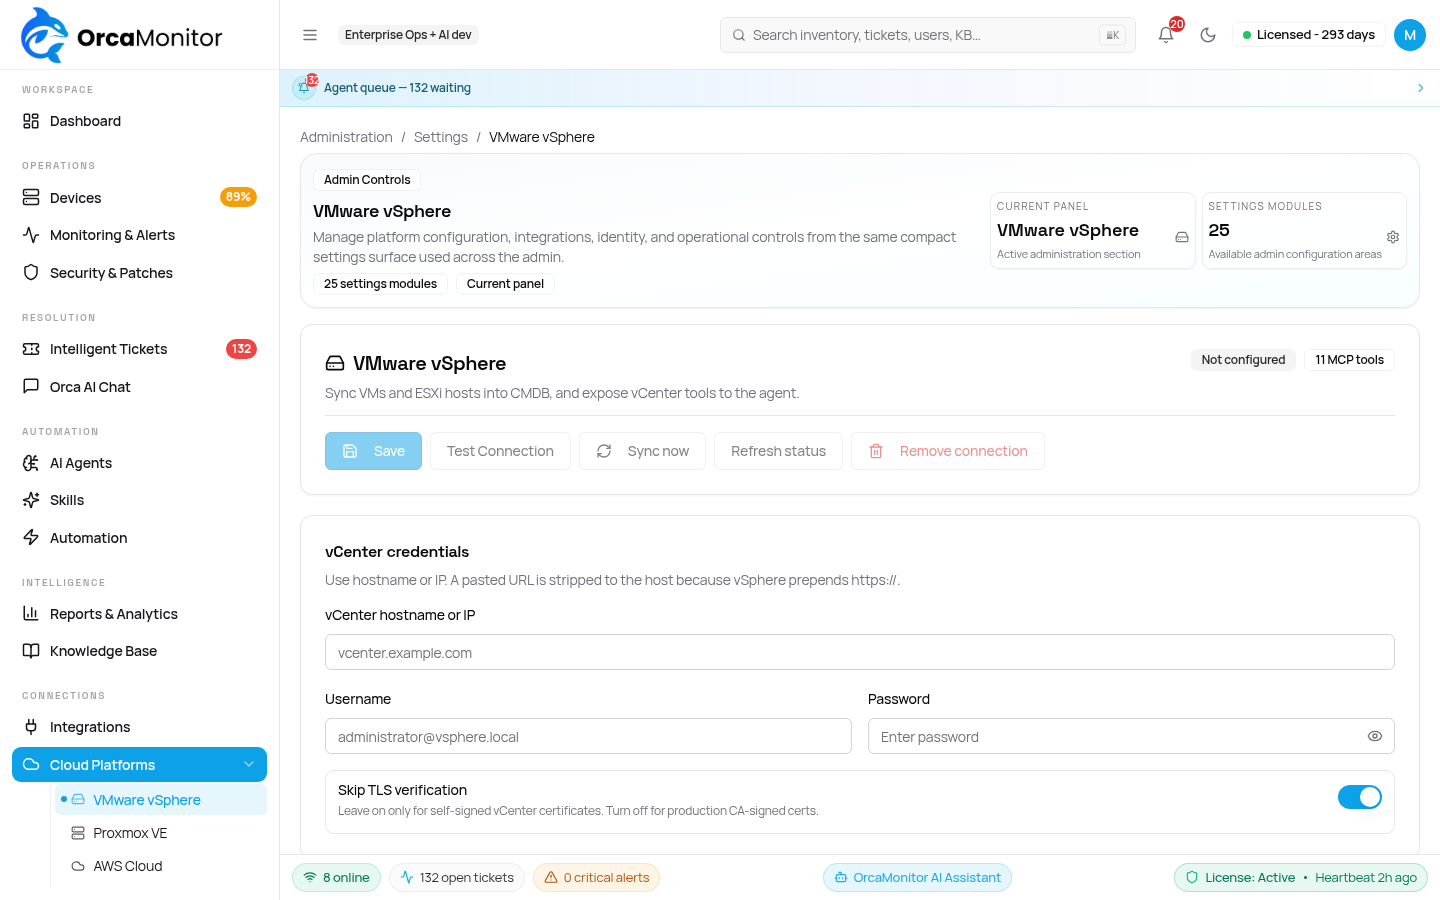
VMware vSphere
UniFi Network
Supports both a local console and the UniFi Cloud Connector. The tool catalog is derived from UniFi's published OpenAPI specification, and calls that need a site id resolve it automatically from the configured default or from the only site on the console.
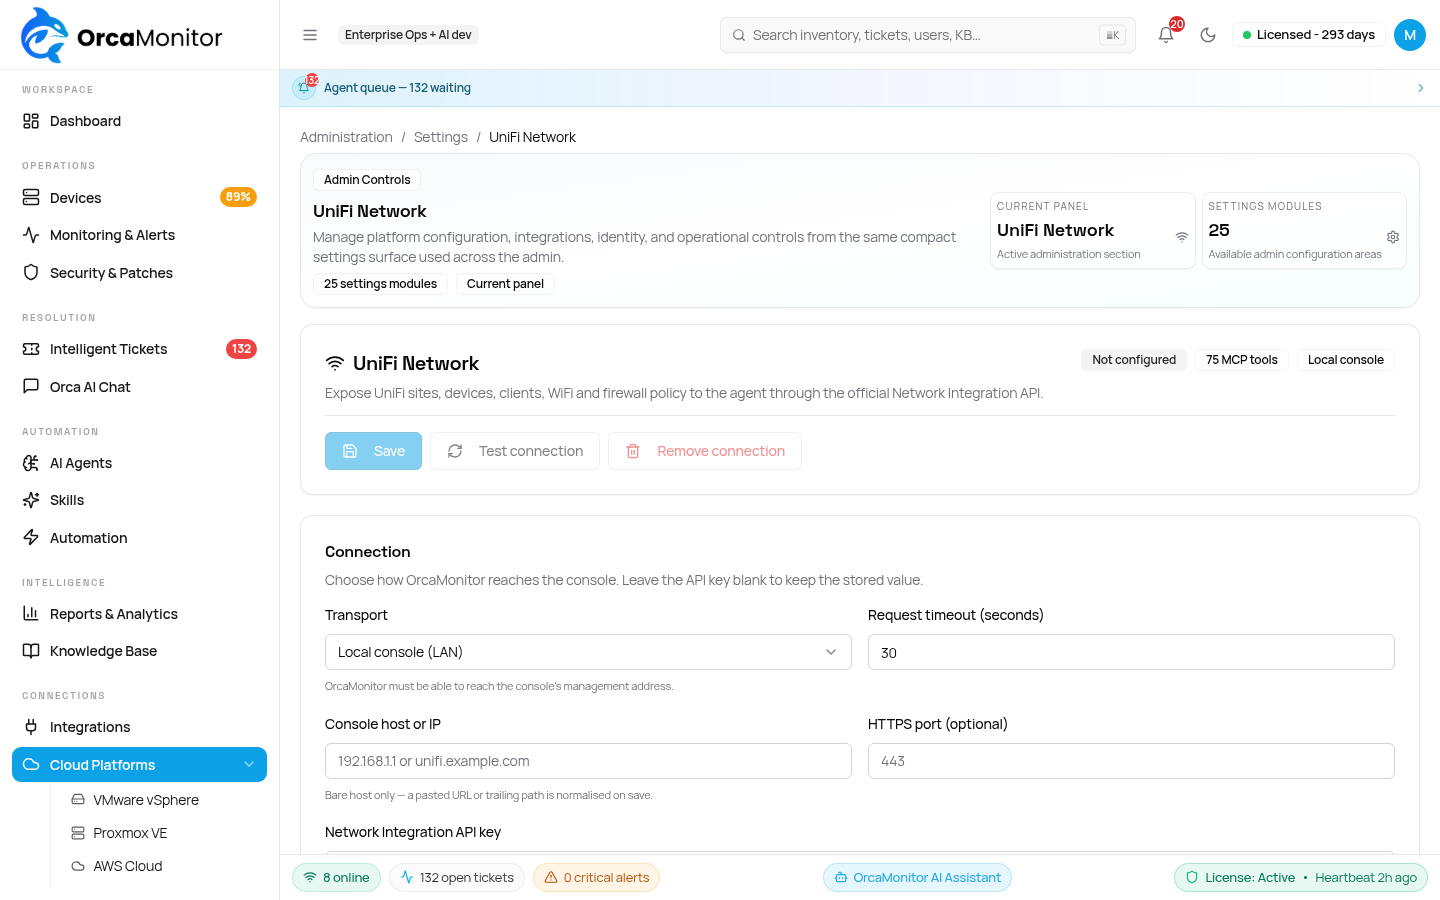
The UniFi Cloud Connector allows 100 requests per minute per console, and the client respects it. A large first sync takes proportionally longer than a local console sync — that is the limiter working, not a hang.
Cisco ISE
Endpoint identity, network access devices, identity groups, TrustSec SGTs and ANC policies. ANC apply and clear are mutating and therefore approval-gated.
AWS, Azure, GCP
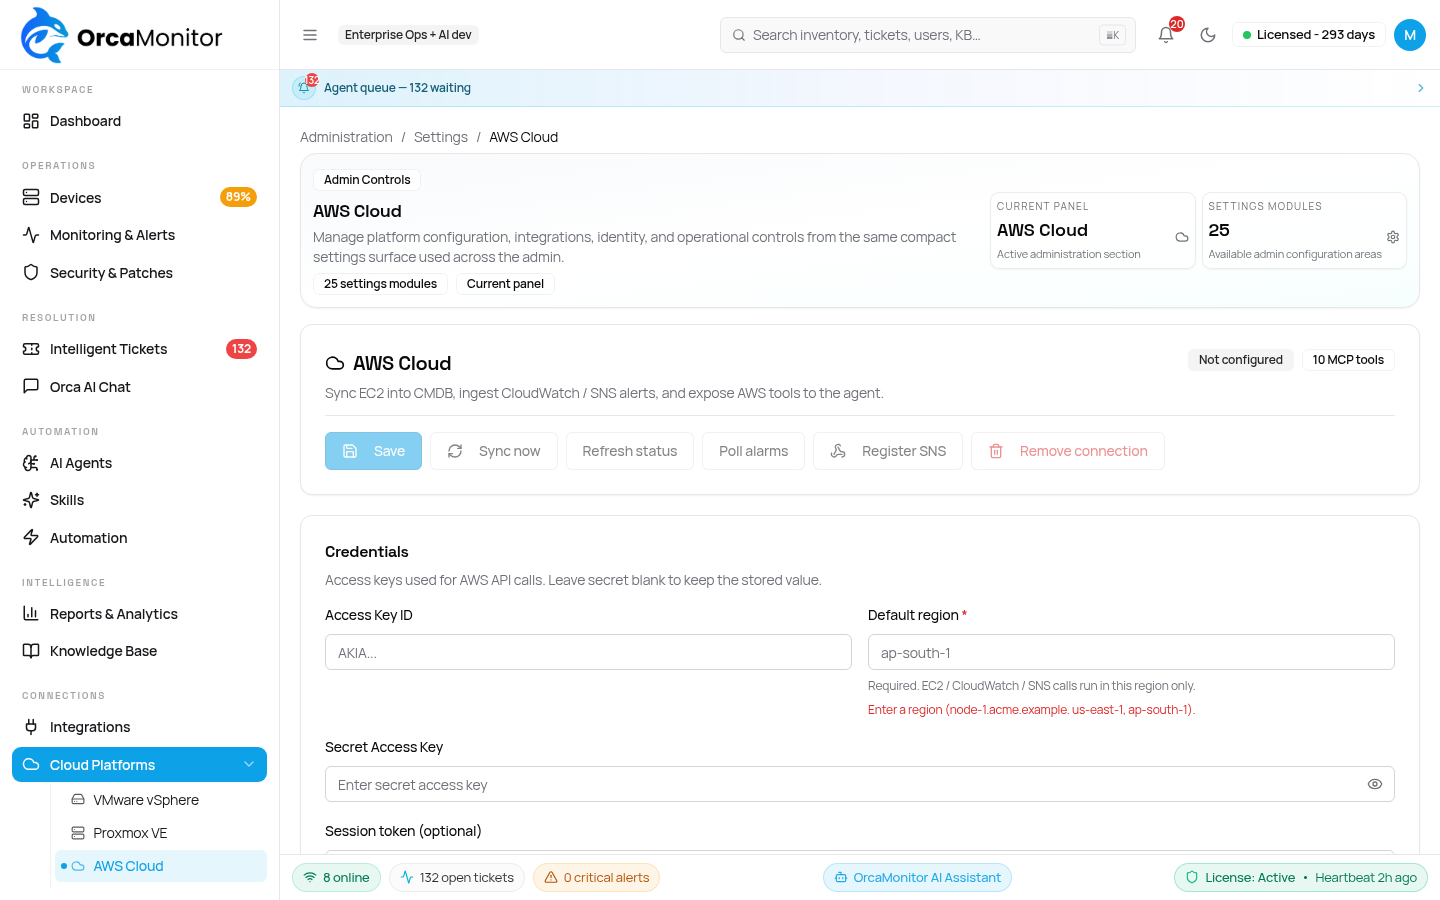
Cloud inventory with read and action tools. Credentials are stored in Vault; the read path is used for inventory and the write path is approval-gated.
Observability (read-only)
Prometheus is queried directly rather than by SSHing to the host. The agent gets instant and range PromQL queries, metric discovery, metadata, and target health — which is what makes "the CPU is spiking" answerable with data instead of a guess.
- PromQL instant and range queries.
- Metric listing and metadata lookup.
- Target health, so a scrape that stopped is distinguishable from a metric that is flat.
- Grafana links can be surfaced alongside Prometheus data for the human view.
Notifications
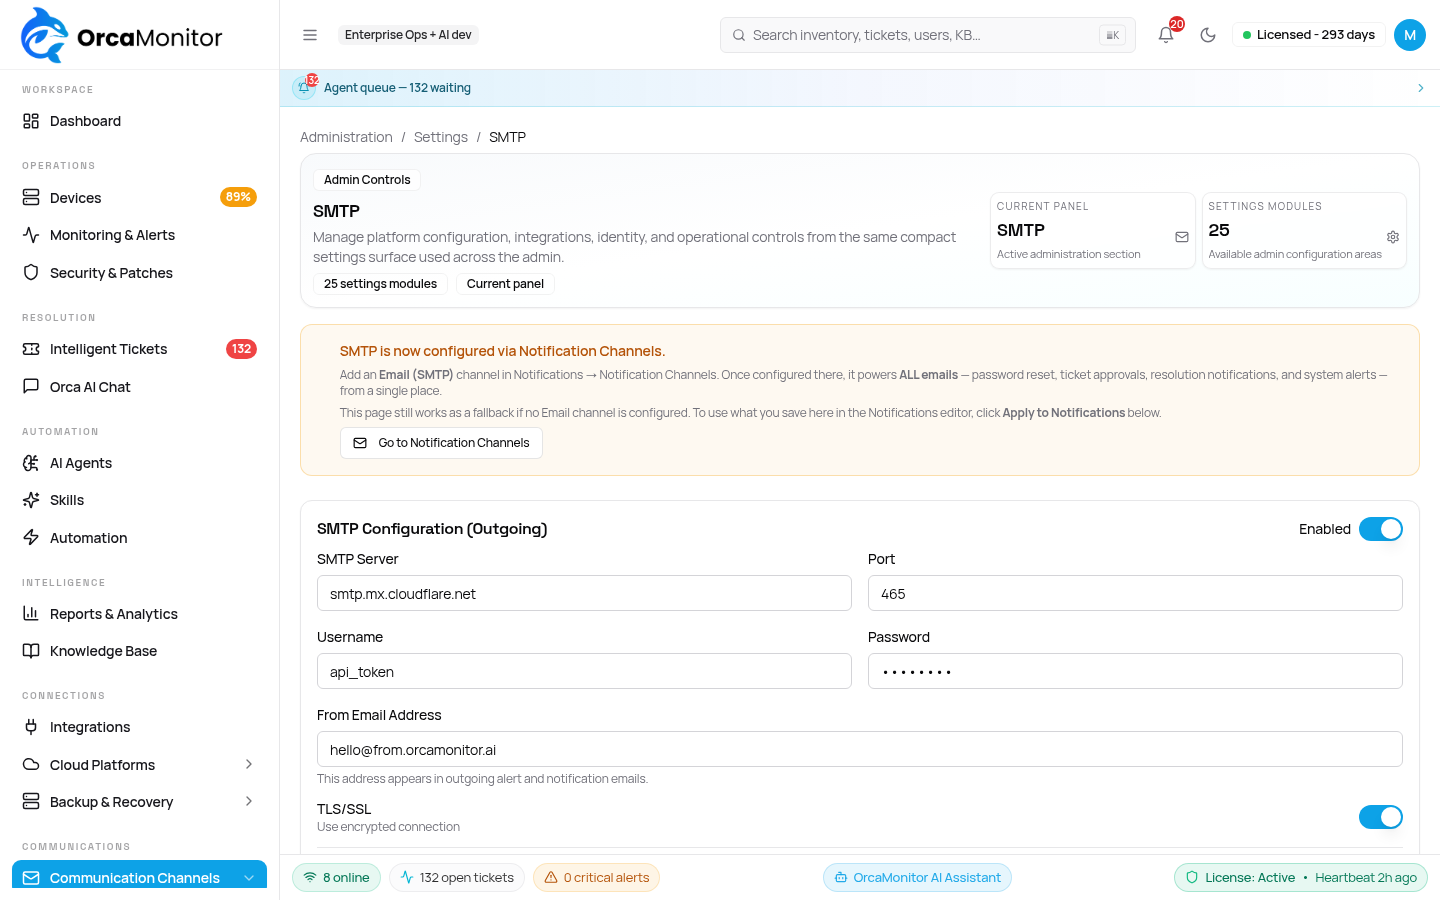
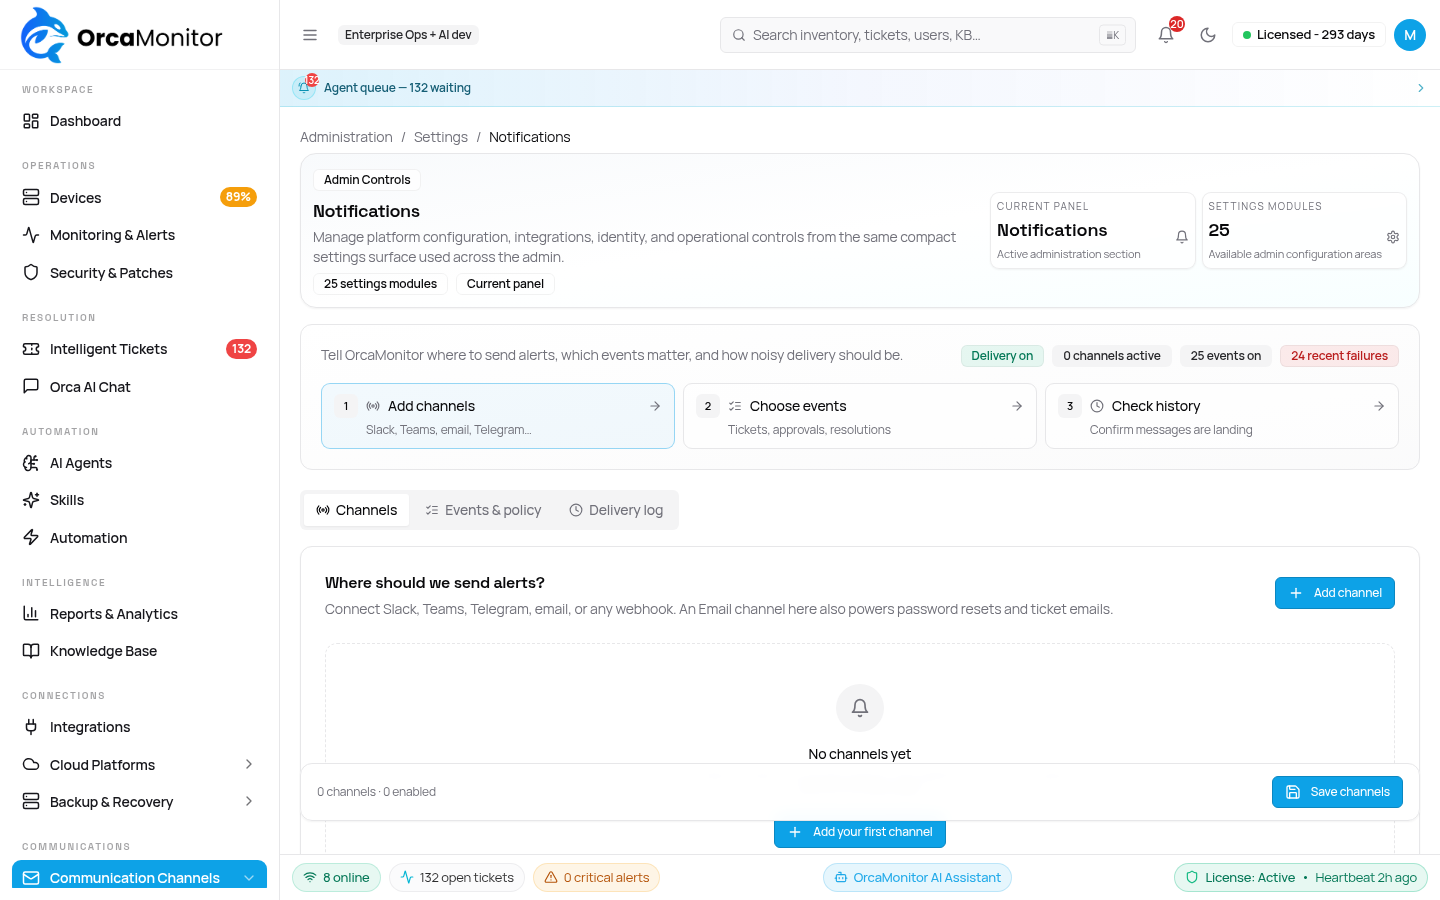
Notifications are how the platform reaches a person who is not looking at it. SMTP delivery is configured once and reused by every notification channel, so ticket mail, alert mail and agent replies all leave through the same relay.
| Channel | Direction | Notes |
|---|---|---|
| Email (SMTP) | Outbound | Used by notifications, tickets and agent replies |
| Slack | Both | Alert and ticket notifications; message handling runs asynchronously |
| Microsoft Teams | Both | Alert and ticket notifications |
| Telegram | Both | Bot-based chat and notifications |
| Both | Cloud API and Twilio variants |
A relay will reject a From address its policy does not allow. If mail is silently not arriving, check the sender address against the relay's rules before assuming the template or the queue is at fault — and read the delivery status, which records the reason per message.
Backups
Workspace configuration can be backed up to a GitHub repository through an OAuth app, with the callback on your own origin. This backs up configuration — devices, integrations, templates — not your network's device configurations, which use the per-device backup feature.
OrcaMonitor documentation v1.0.0 · Report a problem
See every module, pricing tier, and deployment option on the OrcaMonitor overview.