
Documentation menu
Alerts & correlation
Every source, one incident, less noise
An alert is a symptom. A flapping uplink produces dozens of them — one per OID, one per host behind it, one per service that noticed. Correlating them into a single incident before a ticket is opened is the difference between an operations console and an avalanche.
Where alerts come from
Two directions are supported and they behave differently. Inbound webhooks are pushed by the monitoring source; API sources are pulled by OrcaMonitor on a schedule.
| Source | Direction | Notes |
|---|---|---|
| Zabbix | Webhook + API sync | Inventory enrichment pulls Model and OS/version for devices |
| LibreNMS | Webhook | Wrapped and unwrapped payloads both accepted |
| Nagios | Webhook | Handles the wrapped-under-data form as well as flat |
| PRTG | Webhook | Accepts the payload-wrapped form |
| Splunk | Webhook | Flat payload |
| Prometheus | Pull (PromQL) | Read-only queries and alert rules; not a ticket source by itself |
| Meraki, Proxmox, vSphere, UniFi, AWS, Azure, GCP | Pull | Inventory and status. Only some expose an alert surface — see Integrations |
Each source's form shows the exact URL to paste into it. Treat that URL as a credential: it carries an api key, and anyone who has it can create alerts in your workspace. Rotate it if it leaks.
Correlation
Correlation groups alerts that share a cause. The engine is deliberately explainable — it matches on device, on time window, and on the relationships already known from discovery — so you can always answer "why are these two together?" from the alert itself.
- Same device, overlapping window — grouped into one incident.
- Downstream symptoms of a parent (hosts behind a failed uplink) attach to the parent rather than opening their own ticket.
- Recovery closes the correlated incident when the last member recovers, not when the first does.
- A resolved incident that re-fires re-opens with the history intact instead of duplicating.
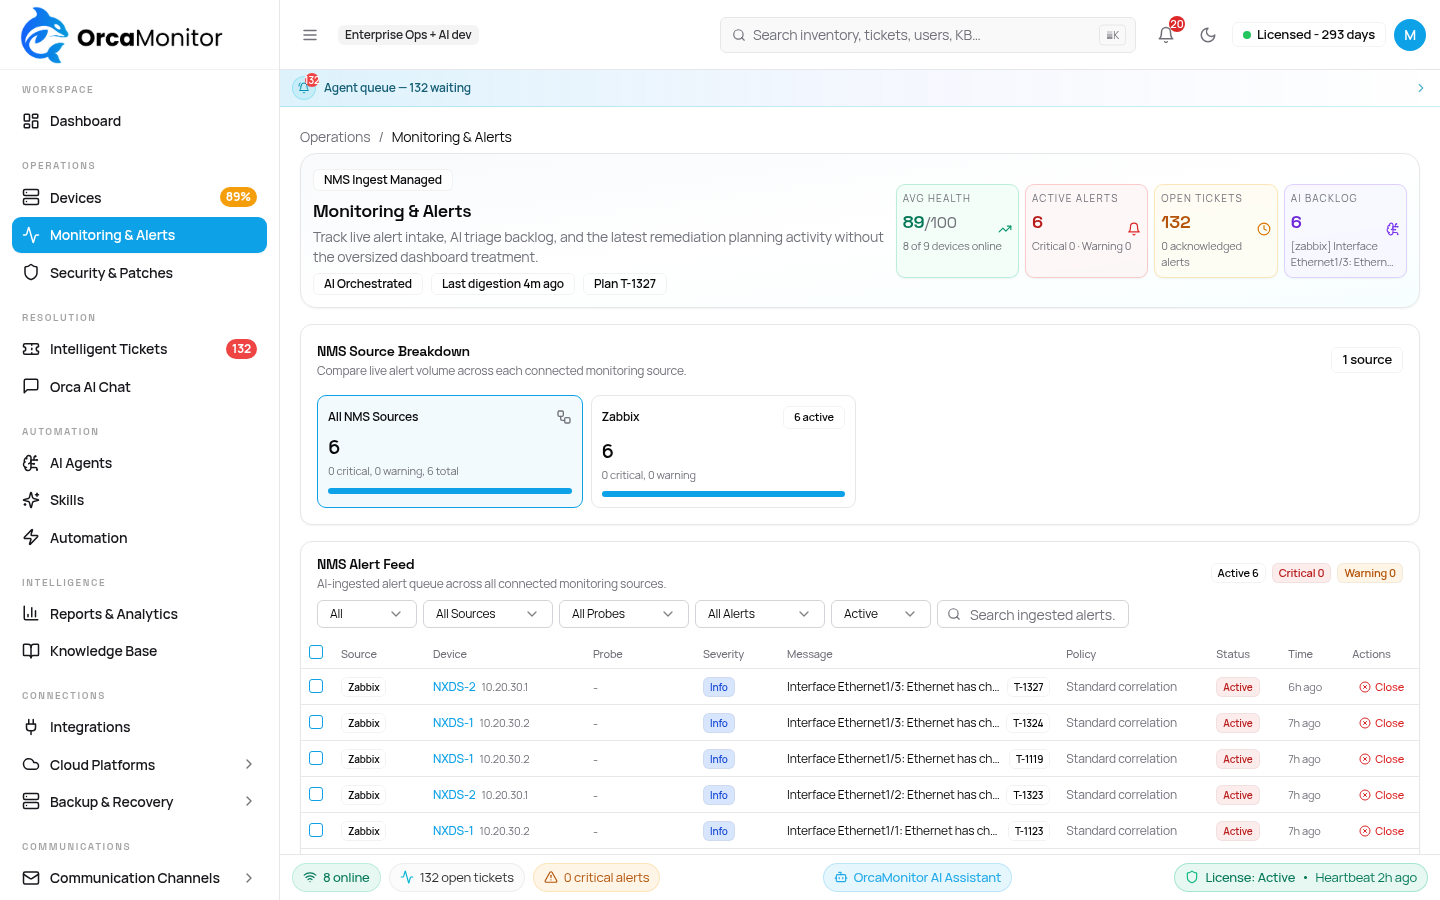
There is no separate alert-detail screen — an alert is worked from its row. The row carries the source it arrived from, the inventory device it was attributed to (or "-" when it could not be matched), its severity, the raw message, the correlation group it landed in, and how long it has been open, so the decision to act never requires opening anything.
- Source — which integration produced it: Zabbix, Meraki, Azure, OpManager, Splunk, PRTG or a custom webhook.
- Device — the cell is a link, so an alert that was matched to inventory jumps straight to that device.
- Correlation — shown on the row, so "why are these two one incident?" is answerable without a second view.
- Age — how long it has been firing, so a stale alert is visible before it becomes work.
- Action — the row's own control closes the alert in place.
Acknowledge, comment, resolve
- 1Acknowledge
Marks the alert as owned. This is how two engineers avoid working the same incident — acknowledgement is visible to everyone immediately.
- 2Comment
Notes attach to the alert and to any ticket derived from it, so the reasoning survives the handover.
- 3Resolve
Closes it deliberately, and propagates the acknowledgement back to sources that support it (Meraki, Azure, OpManager, Splunk, PRTG) so the source does not keep re-notifying.
When the source reports recovery and correlation finds no other member of the group still firing, the incident closes on its own. Manual resolution is for incidents the source will never clear — an event that fired once, or one acknowledged out of band.
From alert to ticket
Whether an alert opens a ticket is a policy decision, not a hard-coded behaviour. Sources that support auto-ticketing expose a switch, and the default is conservative: create a ticket only for incidents that survive correlation.
# Ingest an alert from anything that can send JSON
POST /api/v1/alerts
X-API-Key: <workspace api key>
Content-Type: application/json

{
  "source": "custom",
  "severity": "critical",
  "title": "BGP peer 10.0.0.2 down",
  "device": "bom-core-sw-01",
  "timestamp": "2026-09-18T15:04:05Z"
}
The response includes the alert id and the correlation group it landed in. If the alert opened or attached to a ticket, the ticket id is in the response too — that is the field to log on the sending side.
OrcaMonitor documentation v1.0.0 · Report a problem
See every module, pricing tier, and deployment option on the OrcaMonitor overview.