
Documentation menu
Getting started
From sign-in to your first AI-remediated ticket
OrcaMonitor is the AI operations layer that sits on top of the monitoring you already run. Your NMS keeps detecting problems — OrcaMonitor correlates those alerts, opens a ticket, investigates the device with AI, proposes a fix, and executes it only after a human approves.
Nothing here replaces your NMS. It replaces the part of the job that is still manual: reading alerts, opening a terminal, working out what changed, and typing the fix. This guide takes you from an empty workspace to a resolved ticket, which is the whole product in one pass.
A workspace account, at least one monitored device reachable from OrcaMonitor (SSH or WinRM), and credentials for it — or an existing NMS (Zabbix, LibreNMS, Nagios, PRTG, Splunk, Meraki, Proxmox) that OrcaMonitor can pull from.
Create your workspace
A workspace is the tenant boundary. Every device, ticket, credential, agent and audit entry lives inside exactly one workspace, and no query crosses that line.
- 1Sign up
Open orcamonitor.ai and choose Start free trial. You get 14 days with the full feature set — no feature gating, no credit card.
- 2Verify your email
The verification link lands in your inbox. Corporate domains are enforced at signup, so a personal address will be rejected here rather than after you have configured everything.
- 3Set your password
Passwords need 8+ characters including a number and a symbol. The strength meter is enforced server-side, so a weak password cannot be set via the API either.
- 4Land in the dashboard
The first sign-in goes straight to the operations dashboard. There is no separate setup wizard to finish — configuration happens per integration, as you add it.
Sign in
Sign-in supports email and password, Microsoft SSO, and an optional 30-day remember-me. The same account works across the whole product: the marketing site, the community, and the operations console.
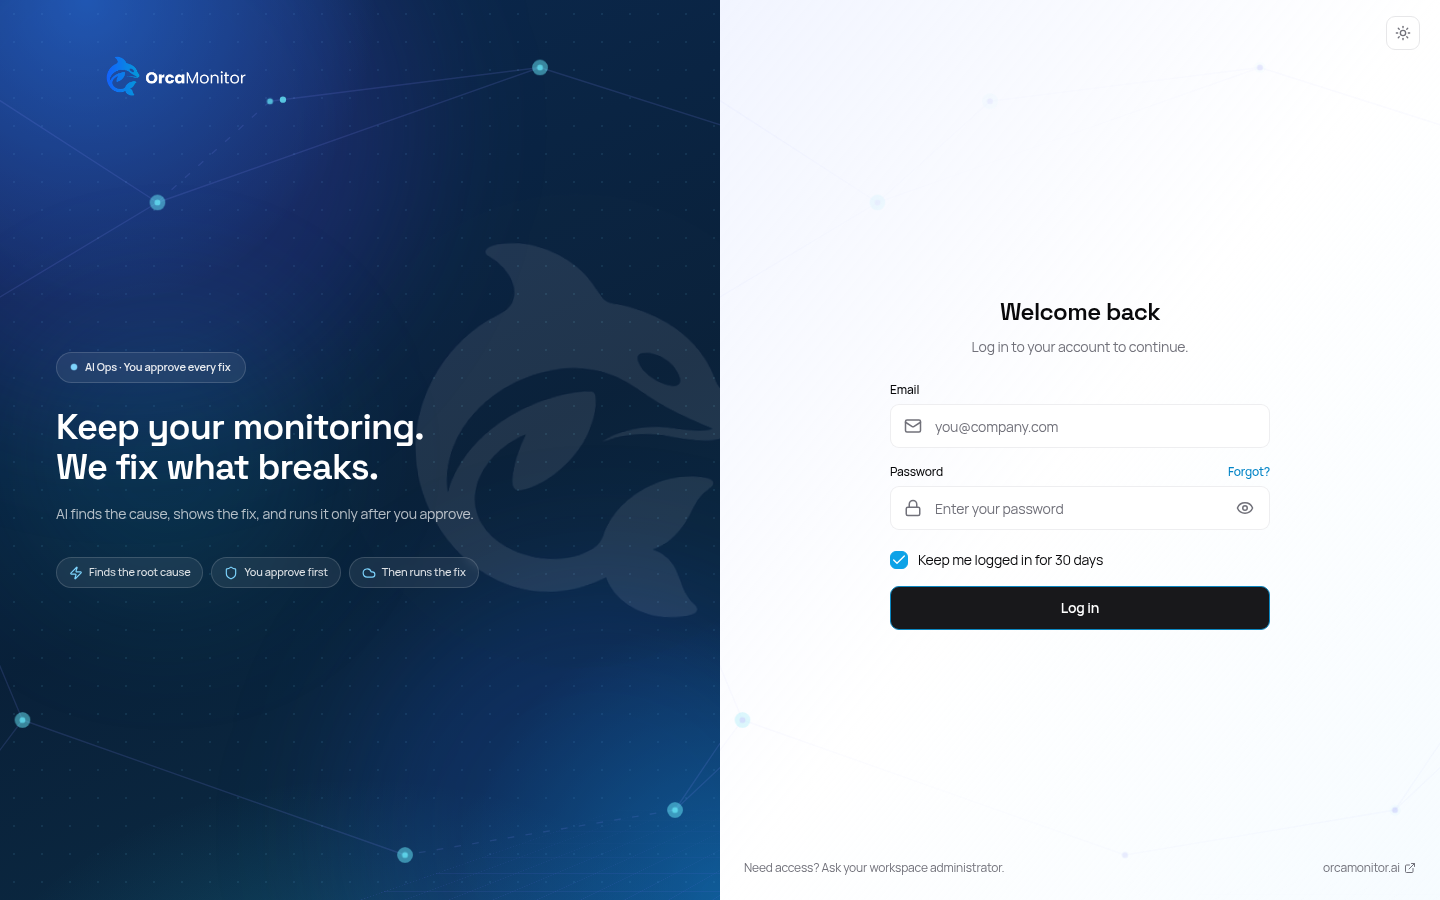
Enable it for a workstation you trust. The refresh cookie is HttpOnly and rotated on every use, so a stolen access token expires quickly on its own — but a stolen refresh cookie is a session. Skip this on shared machines.
Tour the dashboard
The dashboard is the answer to "is anything on fire right now?" — device health, open incidents, alert volume and AI activity in one screen.
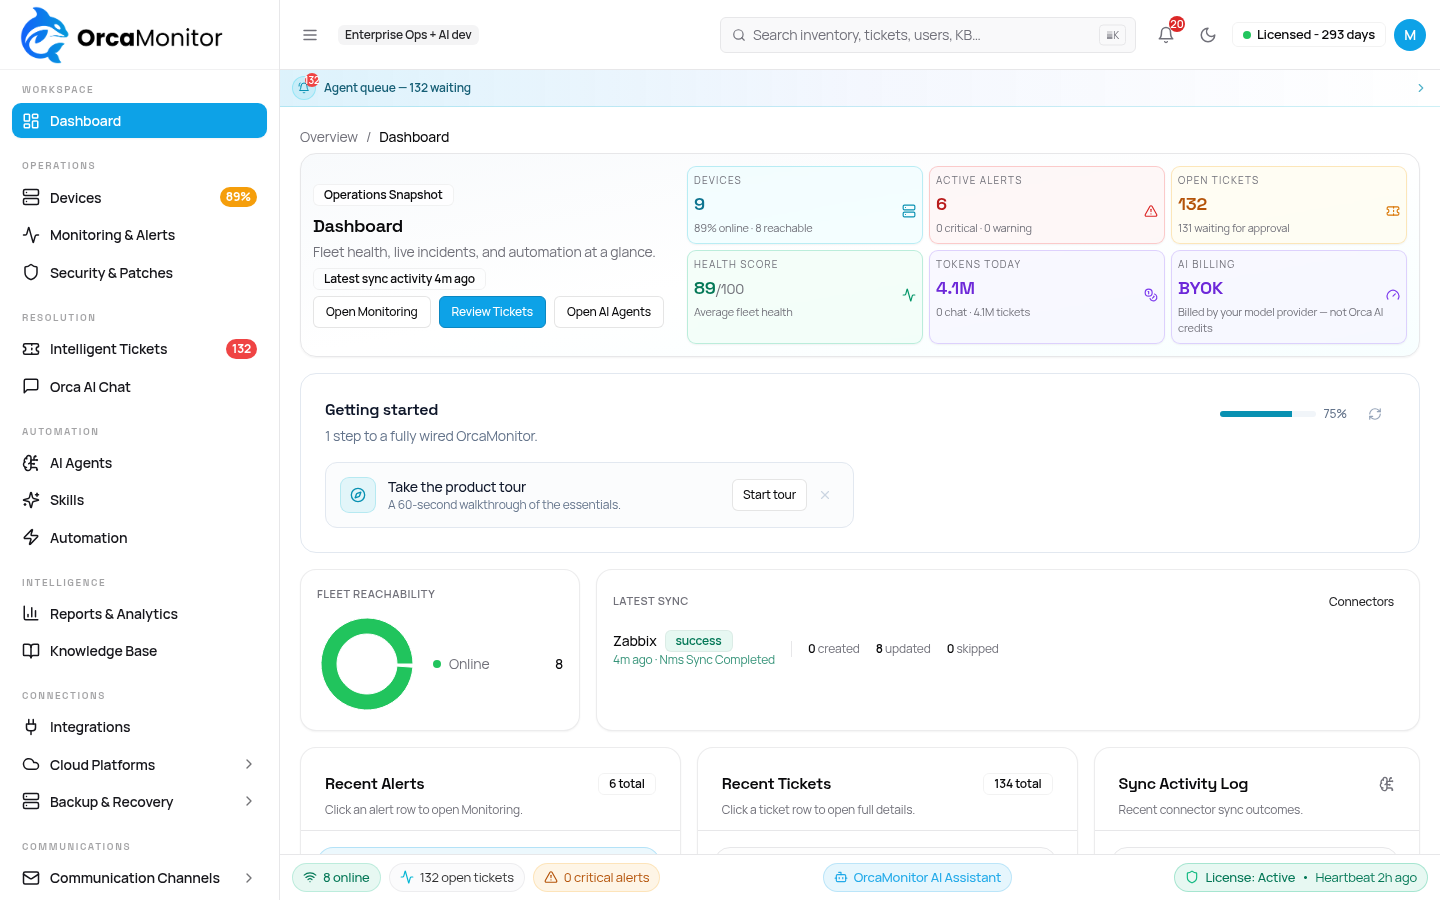
The sidebar is the whole product surface. Each entry maps to one section of these docs, which is why the list below is also your reading order.
| Where | What it answers |
|---|---|
| Dashboard | Is anything broken right now, and what needs a human? |
| Devices | What do I own, what state is it in, and can I reach it? |
| Monitoring & Alerts | What fired, what is it correlated with, and is it noise? |
| Security & Patches | Which CVEs and missing patches affect the fleet? |
| Intelligent Tickets | What is being worked on, by whom, and what is the next step? |
| Orca AI Chat | Can I ask the platform to investigate something right now? |
| AI Agents | Which agents exist, what can they touch, and what have they spent? |
| Automation | Which playbooks exist and what did they last do? |
| Reports & Analytics | How is the fleet trending, and what did we resolve? |
| Integrations | Which monitoring sources and clouds feed this workspace? |
| Settings | Who has access, how do we notify people, and what is audited? |
Add your first device
Devices are the unit of work. A device is anything OrcaMonitor can reach and reason about: a switch, router, firewall, server, hypervisor, or a cloud instance. If a monitoring source is already integrated, devices can arrive on their own — but adding one by hand is the fastest way to see the whole pipeline work.
- 1Open Devices → Add device
Give it a name, the management address, and the device type. The type decides which driver and command set the agent uses.
- 2Attach credentials
Credentials are stored in Vault and referenced by id — never in the device record. Choose a stored credential or create one inline; it is written to Vault before the device row is saved.
- 3Run Test connection
OrcaMonitor opens a real session and reports what the driver negotiated. This is the single most useful button in the product: if it passes here, everything downstream will work.
- 4Let the first discovery run
Facts, interfaces, neighbours and version are collected and stored. The device page fills in over the next minute — no further action needed.
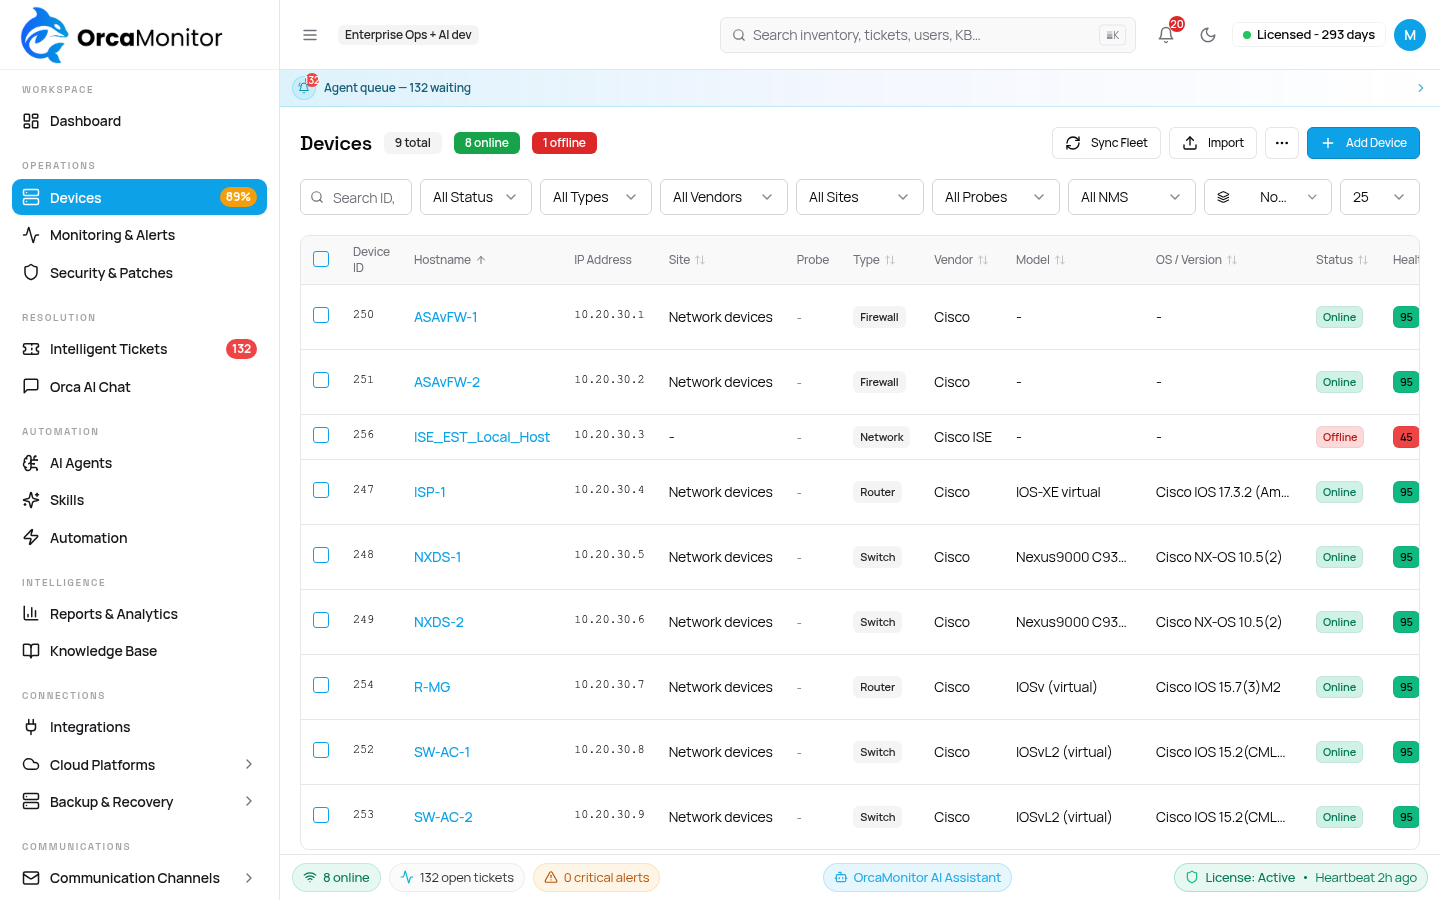
Work down the stack in order: is the management IP reachable from OrcaMonitor at all, does the credential authenticate, does the account have the privileges the command set needs? The error message names which of the three failed — do not guess, read it.
Connect a monitoring source
Alerts are what turn a healthy device into a ticket. You can ingest them from an existing NMS by webhook, or let OrcaMonitor poll the source — either way the alert lands on the same alert record and enters the same correlation engine.
- Zabbix — webhook and API sync, including inventory enrichment for Model and OS.
- LibreNMS, Nagios, PRTG, Splunk — inbound webhook ingest.
- Meraki, Proxmox, vSphere, UniFi, AWS, Azure, GCP — API sync plus status reconciliation.
- Prometheus — alert rules and PromQL, queried read-only over the OrcaMonitor MCP tools.
The Integrations section covers each source in detail, including which ones can auto-create tickets and which are inventory only.
Watch the first ticket resolve
This is the part worth waiting for. With a device and a source connected, take an alert through the full loop and watch where the human is still in the loop — the approval step is the design, not a limitation.
- 1An alert arrives and correlates
Related alerts from the same device collapse into one incident instead of one ticket per symptom.
- 2A ticket opens with evidence attached
The ticket carries the alert, the device, the recent change history and any related open incidents.
- 3The agent investigates
It reads the device with the same MCP tools you can call by hand. Every command it runs is recorded on the ticket.
- 4A plan is proposed
The agent states the root cause and the exact commands it wants to run. This is a plan, not a change.
- 5You approve or reject
Approval is a deliberate click. Reject it and the agent stops and hands back; there is no retry loop that wears you down.
- 6Execution is verified
The change is applied, then the objective is checked. If verification fails, a recorded backup can be restored exactly once and the ticket returns to Verifying fix rather than silently closing.
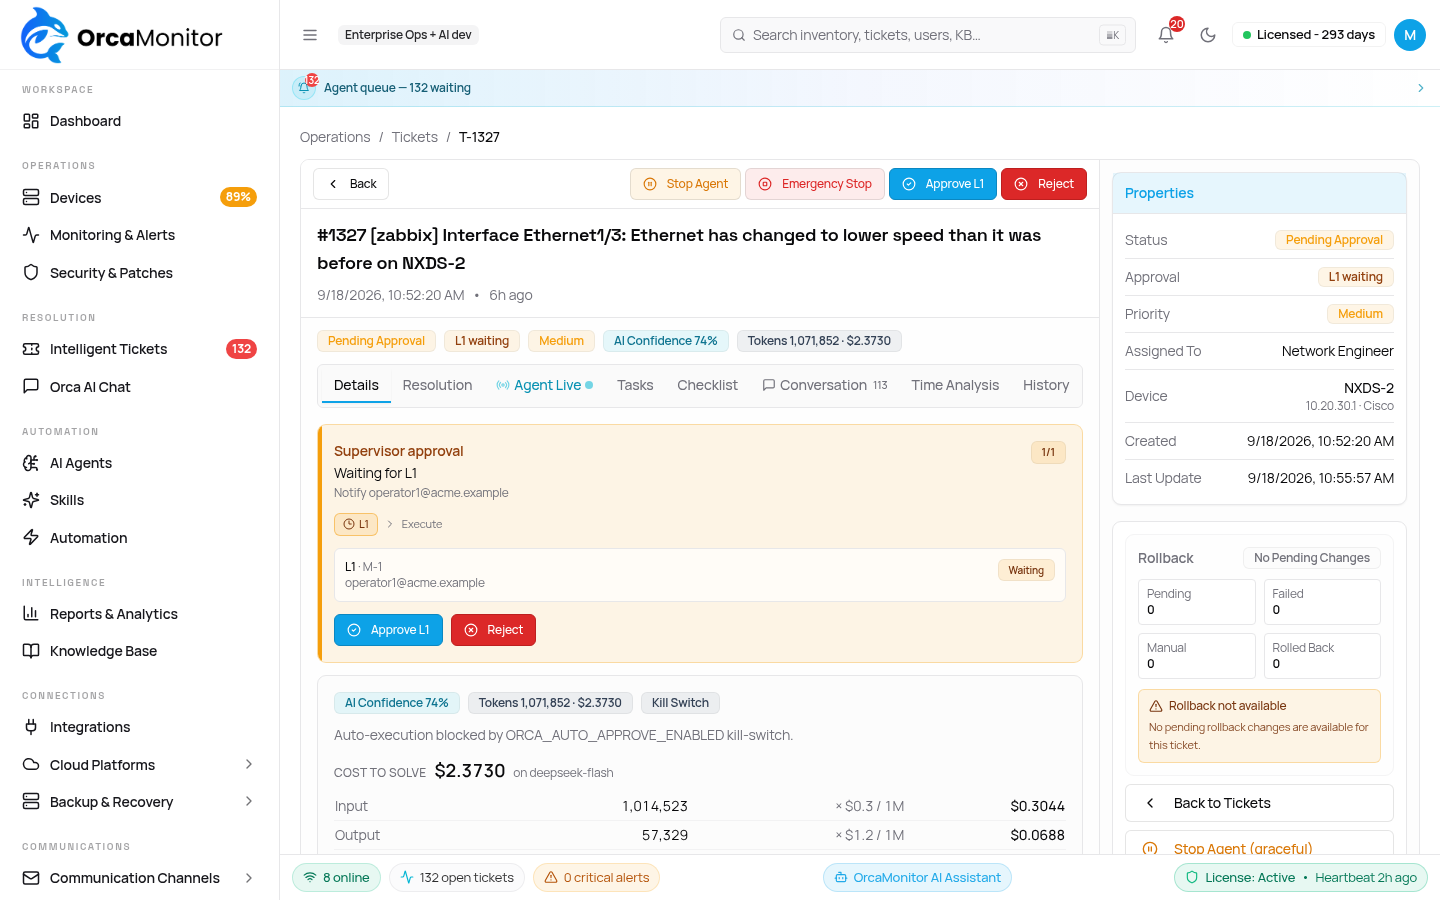
Autonomous remediation without a human gate is a liability in a production network. OrcaMonitor is built so the AI does the diagnosis and the typing, and a person owns the decision — and so every one of those decisions is attributable afterwards.
Where to go next
OrcaMonitor documentation v1.0.0 · Report a problem
See every module, pricing tier, and deployment option on the OrcaMonitor overview.