
OrcaMonitor documentation
Console, instance features, and on-prem routing
Sign in to the cloud console, open your dedicated instance, and route private LAN traffic over WireGuard or IPsec. Below is every console tab and every instance module — what it does and where to open it.
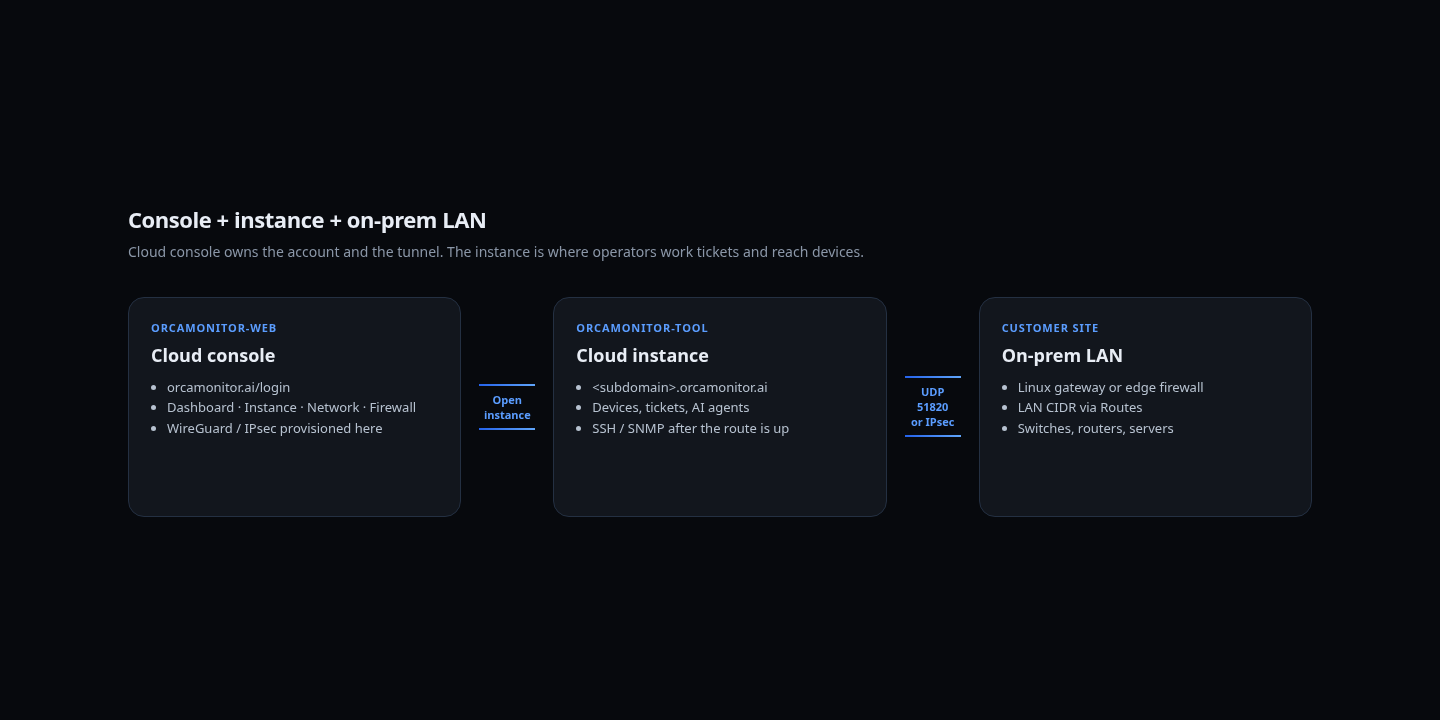
The console does not SSH into your lab. The instance does — after a LAN route or IPsec tunnel is up.
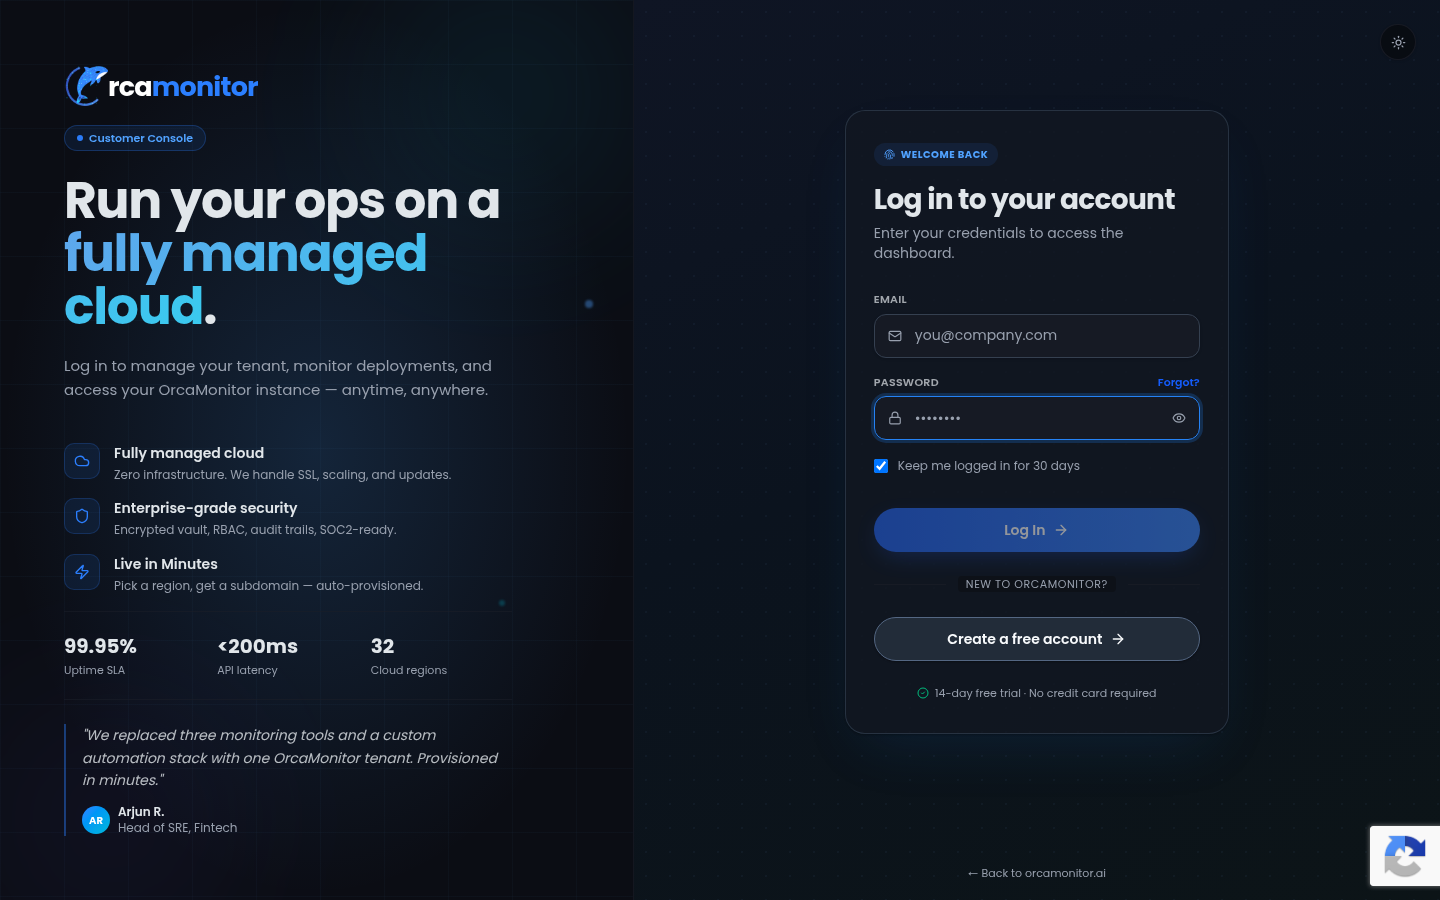
Dashboard
Log in at orcamonitor.ai/login with the tenant email from signup. That opens the customer console — not the instance. After login you land on /dashboard.
- Overview. Plan, license, trial, and Launch OrcaMonitor. This is the home after console login.
- Instance. Subdomain URL, region (BOM), uptime, add-ons such as Zabbix. Copy URL or open the tool.
- Network. WireGuard mesh, peers, LAN routes, and IPsec. This is how on-prem IPs reach the instance.
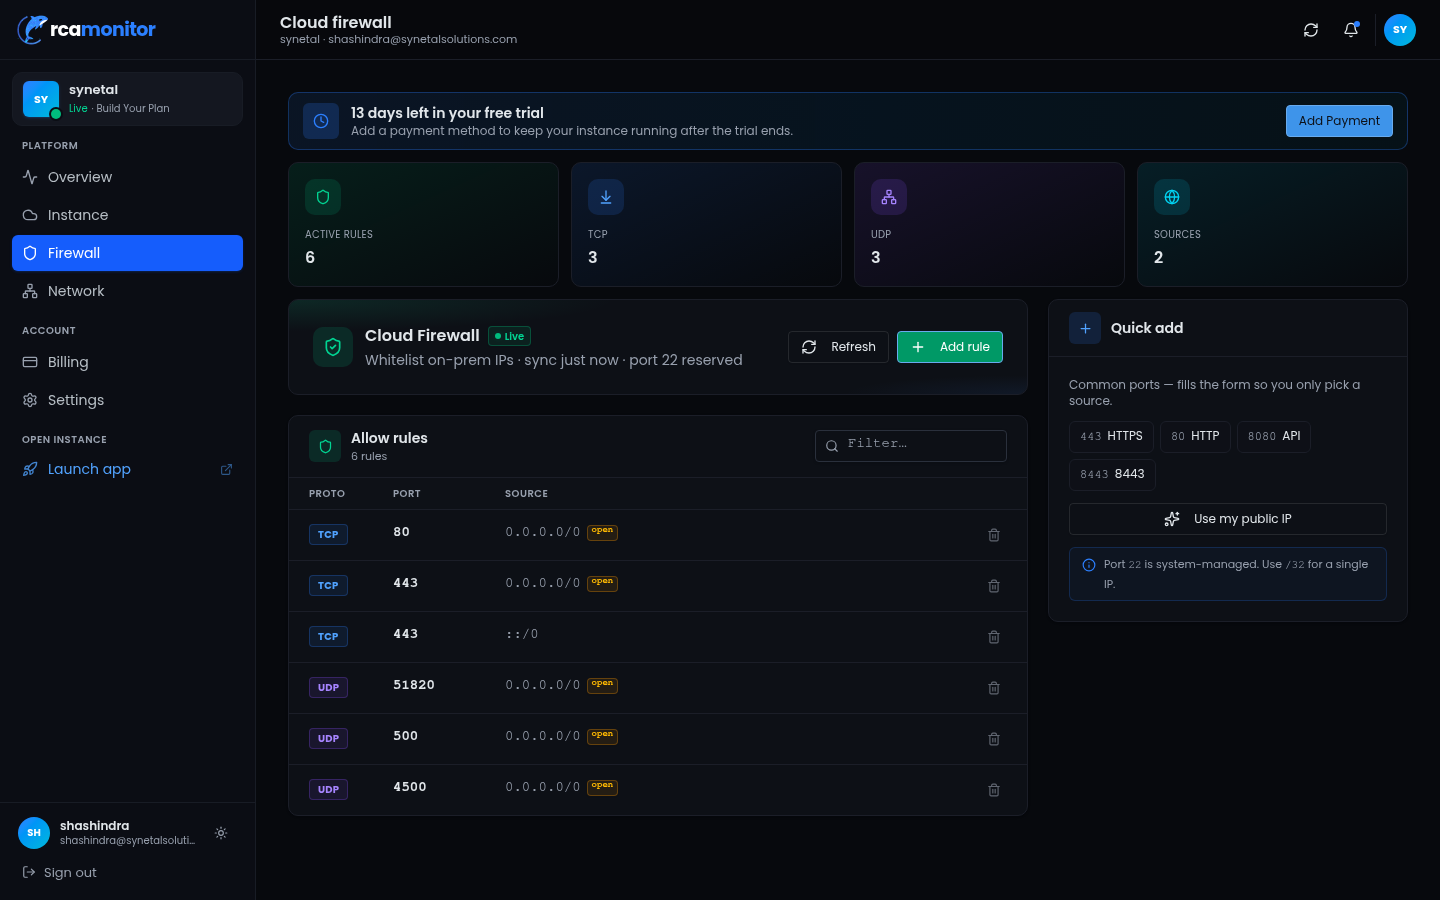
- Firewall. VPS public allow-list (TCP 443, UDP 51820, and so on). Not the VPN. Port 22 is reserved.
- Billing. Plan, seats, invoices, and payment method so the instance stays running after trial.
- Settings. Tenant profile, users on the console, and account deletion. Operator RBAC lives in the instance.
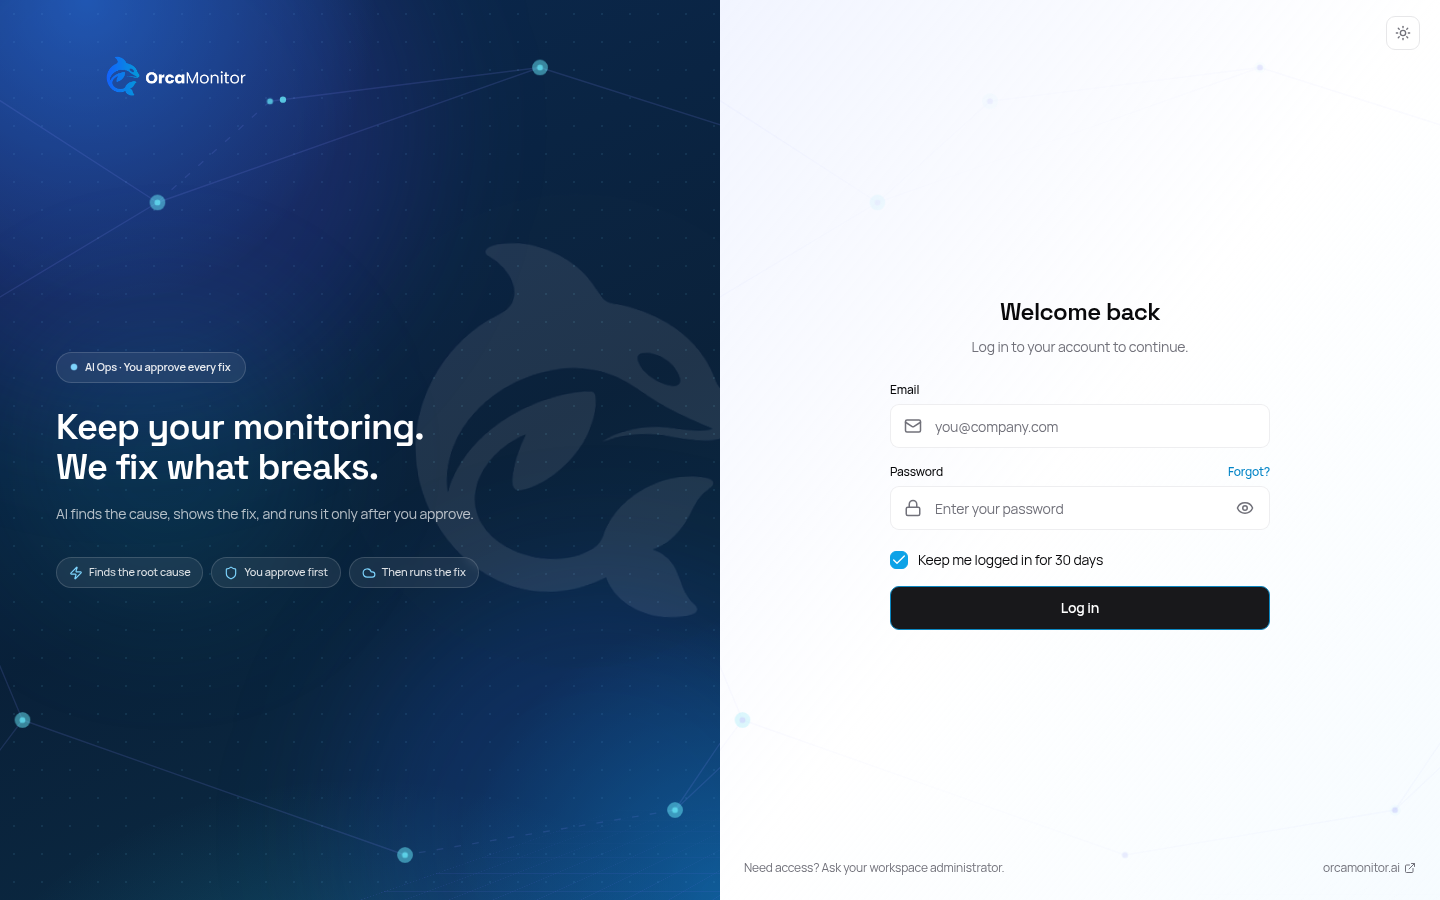
Use Launch app / Open instance to enter orcamonitor-tool. That is a second login (operator account, RBAC, optional TOTP). It does not reuse the console session.
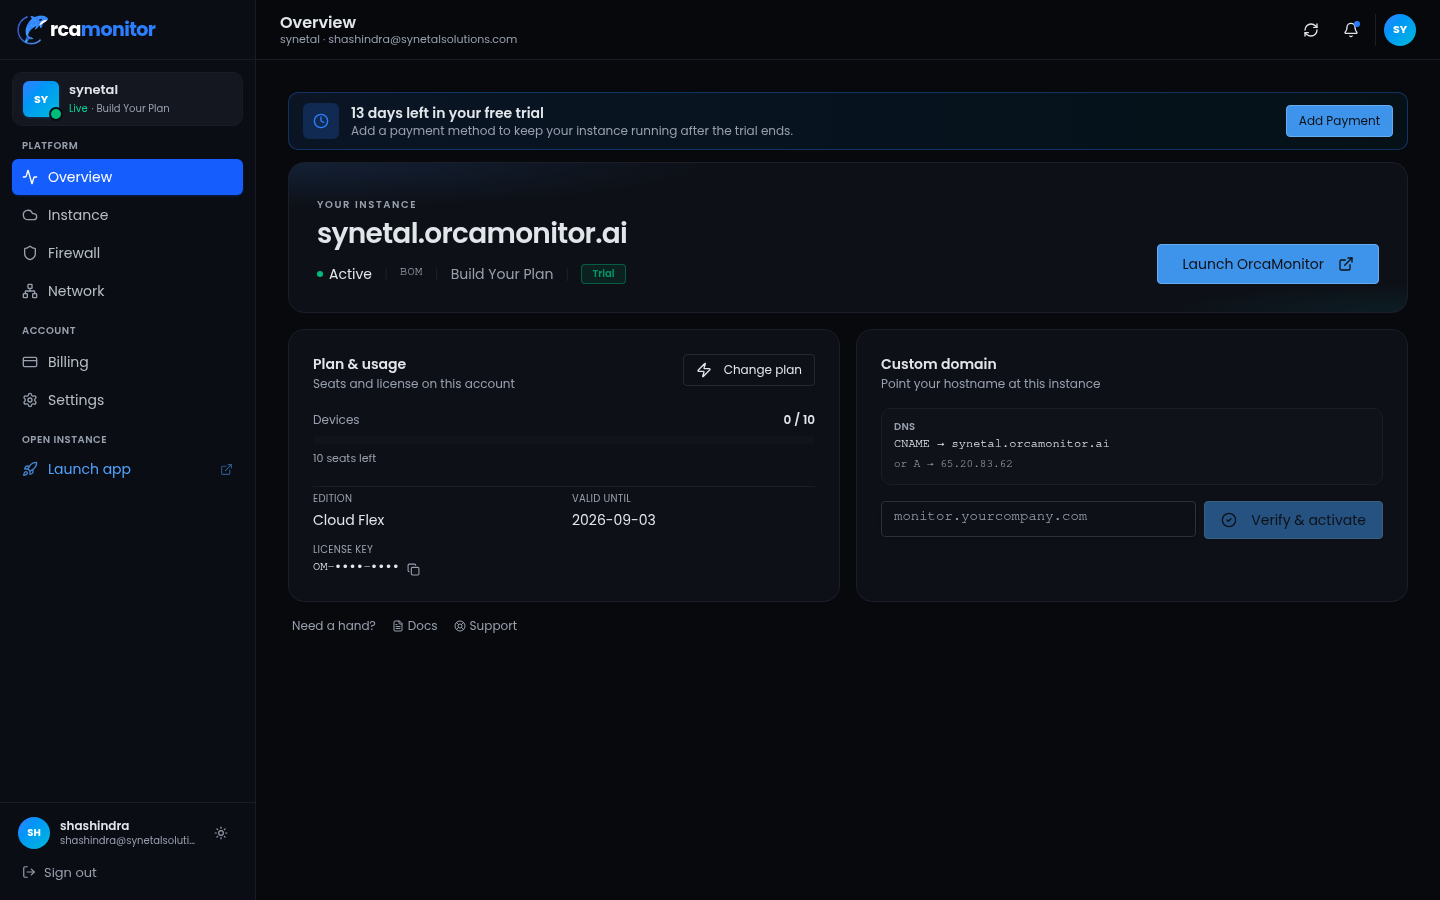
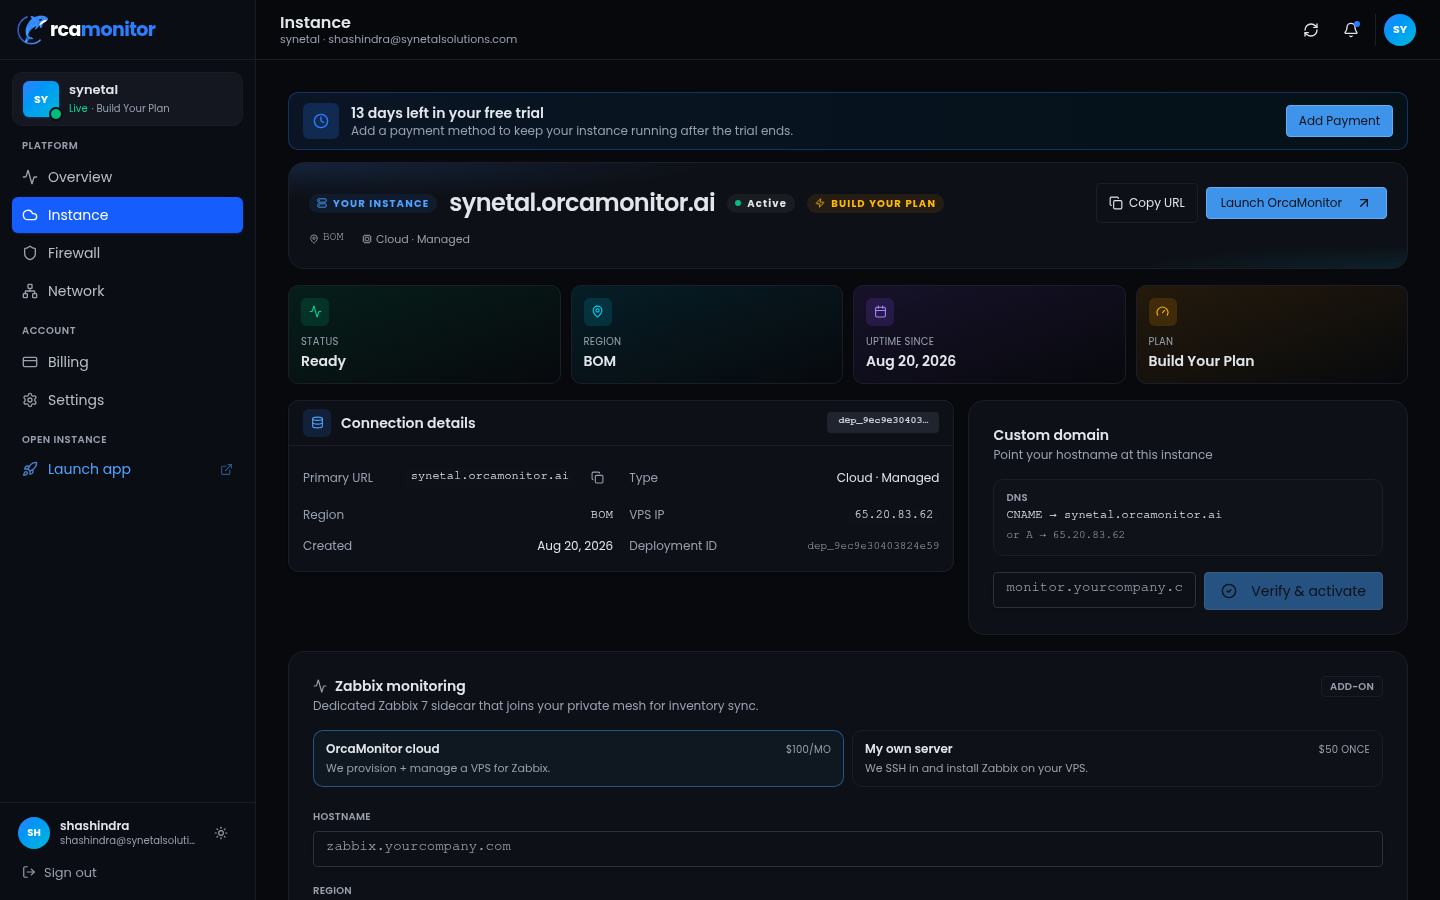
Cloud instance
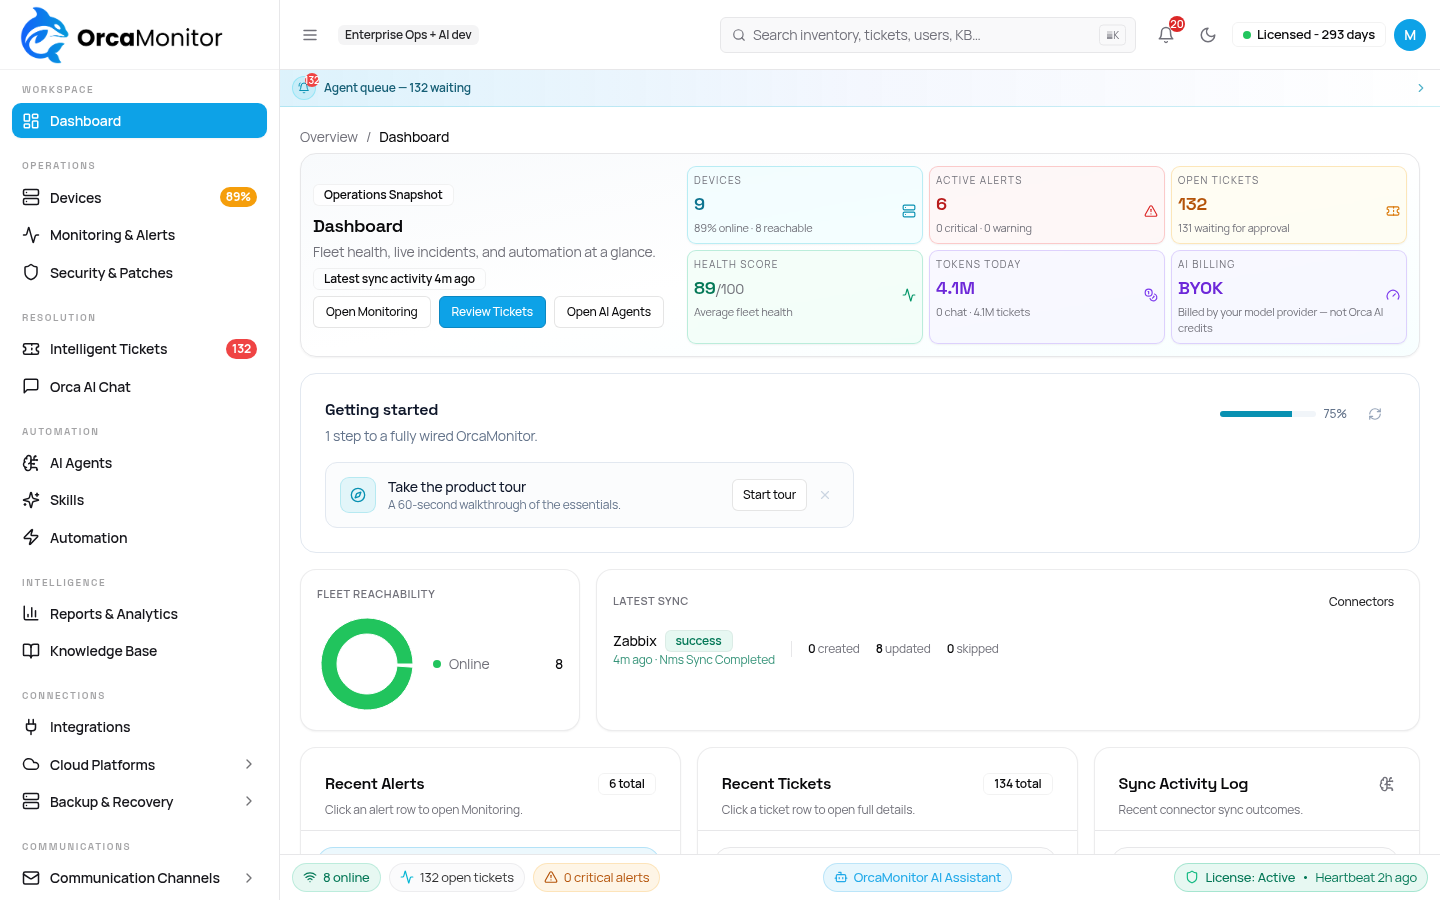
The instance is orcamonitor-tool, at https://<subdomain>.orcamonitor.ai. This is the product operators use every day. The left sidebar is the feature map — each item is explained in the catalog below.
- Workspace — dashboard snapshot of fleet and tickets
- Operations — devices, alerts, security/patches
- Resolution — tickets with Approve, plus AI chat
- Automation — agents, skills, playbooks
- Connections — NMS, cloud platforms, backups
Instance features
Same labels as the left sidebar after you launch the instance. Paths are relative to your subdomain.
Workspace
Dashboard
/Fleet health, open tickets, AI credits, agent queue, and latest NMS sync. Start here after instance login.
Operations
Devices
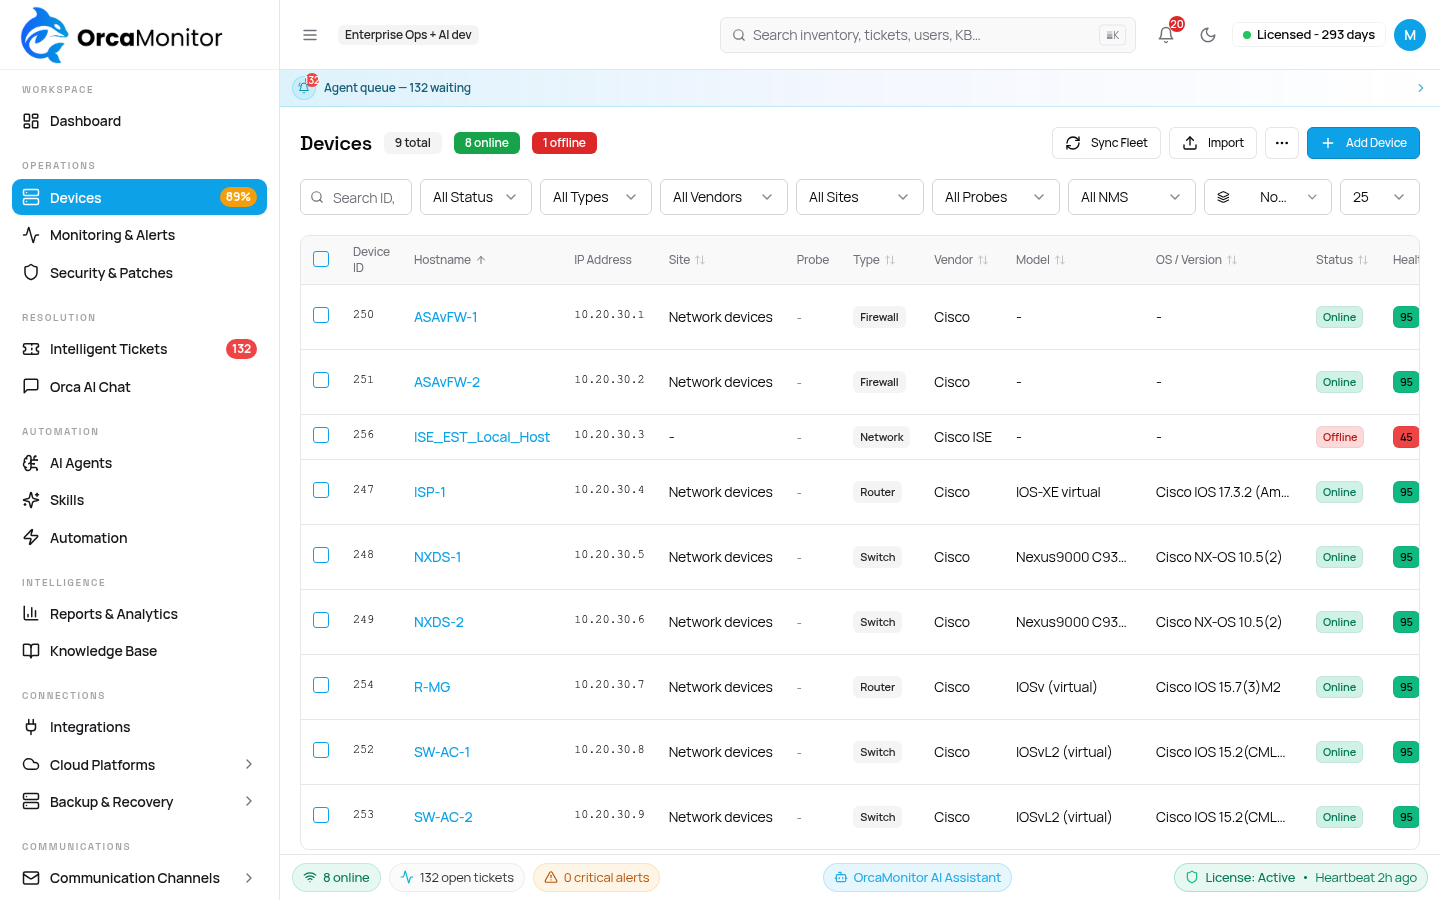
/devicesCMDB for every switch, firewall, router, and server. Hostname, private IP, vendor, site, health, Vault credentials, and NMS source. SSH and ping run from the instance against this IP — they fail until a LAN route exists.
Monitoring & Alerts
/monitoringLive alerts from Zabbix, LibreNMS, and webhooks. Correlation and severity mapping happen here before a ticket opens, so operators are not flooded with duplicates.
Security & Patches
/securityVulnerability and patch status for the fleet (OpenVAS / Greenbone where licensed). Use it to see which devices are exposed, then open or approve a ticket to remediate.
Resolution
Intelligent Tickets
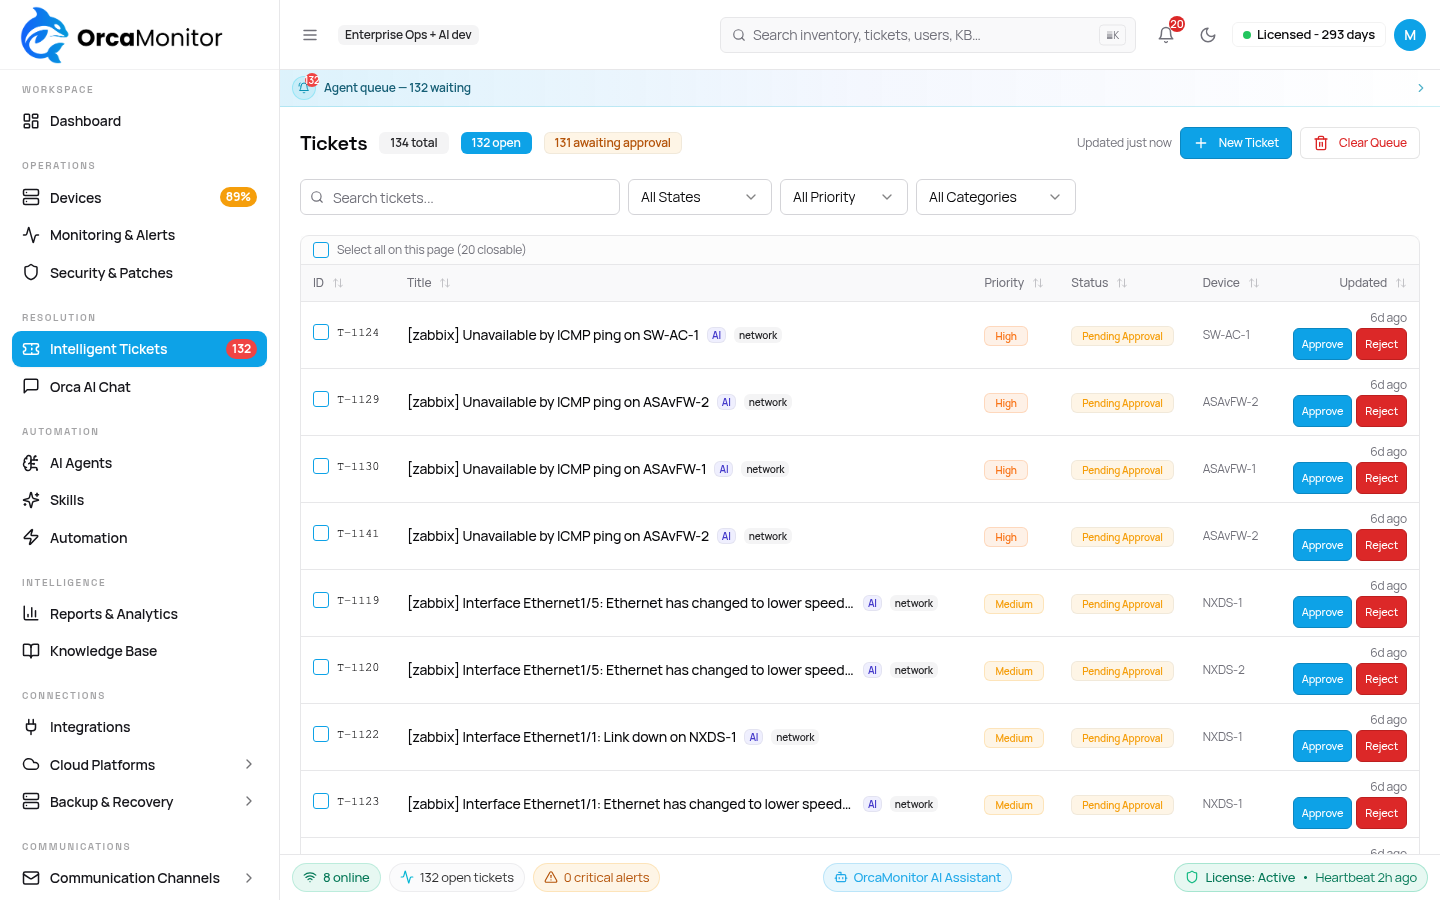
/ticketsIncidents auto-created from alerts. The agent writes a plan; you Approve or Reject on the ticket (L1 → Ln). After approval it executes SSH / Nornir / MCP on the CMDB device, then validates. Failed tickets with a plan can be approved again.
Orca AI Chat
/agent-chatOperator chat against inventory and tools (DeepSeek Harness). Ask about a device, a path, or a VPN without opening a ticket. Mutating work still belongs on a ticket with approval.
Automation
AI Agents
/ai-agentsRoles that own ticket categories (network, firewall, Linux). Each agent has skills, model, and an approval chain. The coordinator assigns by specialist fit; load is a tie-breaker.
Skills
/ai-skillsReusable playbooks the agents call — vendor CLI, VPN diagnose, config backup. Attach a skill to an agent instead of pasting commands into every ticket.
Automation
/automationScheduled or manual playbooks (health checks, backups) with approval gates and an execution log. AI can propose a playbook; it still waits for a human.
Intelligence
Reports & Analytics
/reportsMTTR, ticket volume, device health, and credit usage. Use this for ops reviews, not for live firefighting.
Knowledge Base
/knowledge-baseRunbooks and resolved-incident writeups. Agents retrieve matching articles when they plan a ticket so the next similar alert is faster.
Connections
Integrations
/integrationsNMS connectors (Zabbix, LibreNMS, and others). Webhooks from those tools create alerts and tickets on this instance.
Cloud Platforms
/settings/awsAWS, Azure, VMware vSphere, Cisco Meraki. Inventory and automation for cloud/controller gear that is not on the on-prem LAN.
Backup & Recovery
/settings/backupGitHub backup of instance config and run state. Restore after a host rebuild without re-entering devices by hand.
Communications
Notification Routing
/settings/notificationsWho gets paged for which severity — Slack, Teams, Telegram, WhatsApp, email.
SMTP Delivery
/settings/smtpOutbound mail for approval emails and ticket updates.
Bot Channels
/settings/bot-channelsChat bots that can open or approve tickets from the ops channel.
Support Mailboxes
/mail-accountsInbound mailboxes that turn operator email into tickets.
Access & Security
Users & Roles
/settings/usersInstance operators, RBAC modules, and staff vs operator. Separate from the cloud-console tenant login.
Credential Vault
/settings/credentialsSSH, SNMP, and API secrets used by devices and agents. Not stored in the ticket text.
Azure SSO
/settings/azure-ssoOptional Microsoft login for operators (license feature).
Audit Logs
/settings/auditSystem and chat audit: who approved, who ran a command, who talked to the agent.
Platform
AI Models
/settings/ai-modelsMain model and reasoning/fast model for planning. Credits meter every completion; a cap pauses tickets instead of failing them.
Approval Workflow
/settings/approval-policyL1 → Ln supervisor chain, auto-approve kill-switch, and who must sign before execute.
License & Billing
/settings/licenseInstance license key and feature flags (AI remediation, SSO, audit). The console Overview tab shows the same key for the tenant.
Devices
After the tunnel is up, add on-prem gear in Devices using the private IP. Each row is hostname, type, vendor, site, Vault SSH/SNMP credentials, and optional NMS source.
- Sync Fleet pulls from the connected NMS so you do not type every host.
- Add Device is for one-offs: IP, vendor, credentials from the Vault.
- Health % and last-seen come from ping/SNMP after the LAN route exists.
- Without a WireGuard/IPsec route, the device can sit in the CMDB and still be unreachable.
Incidents
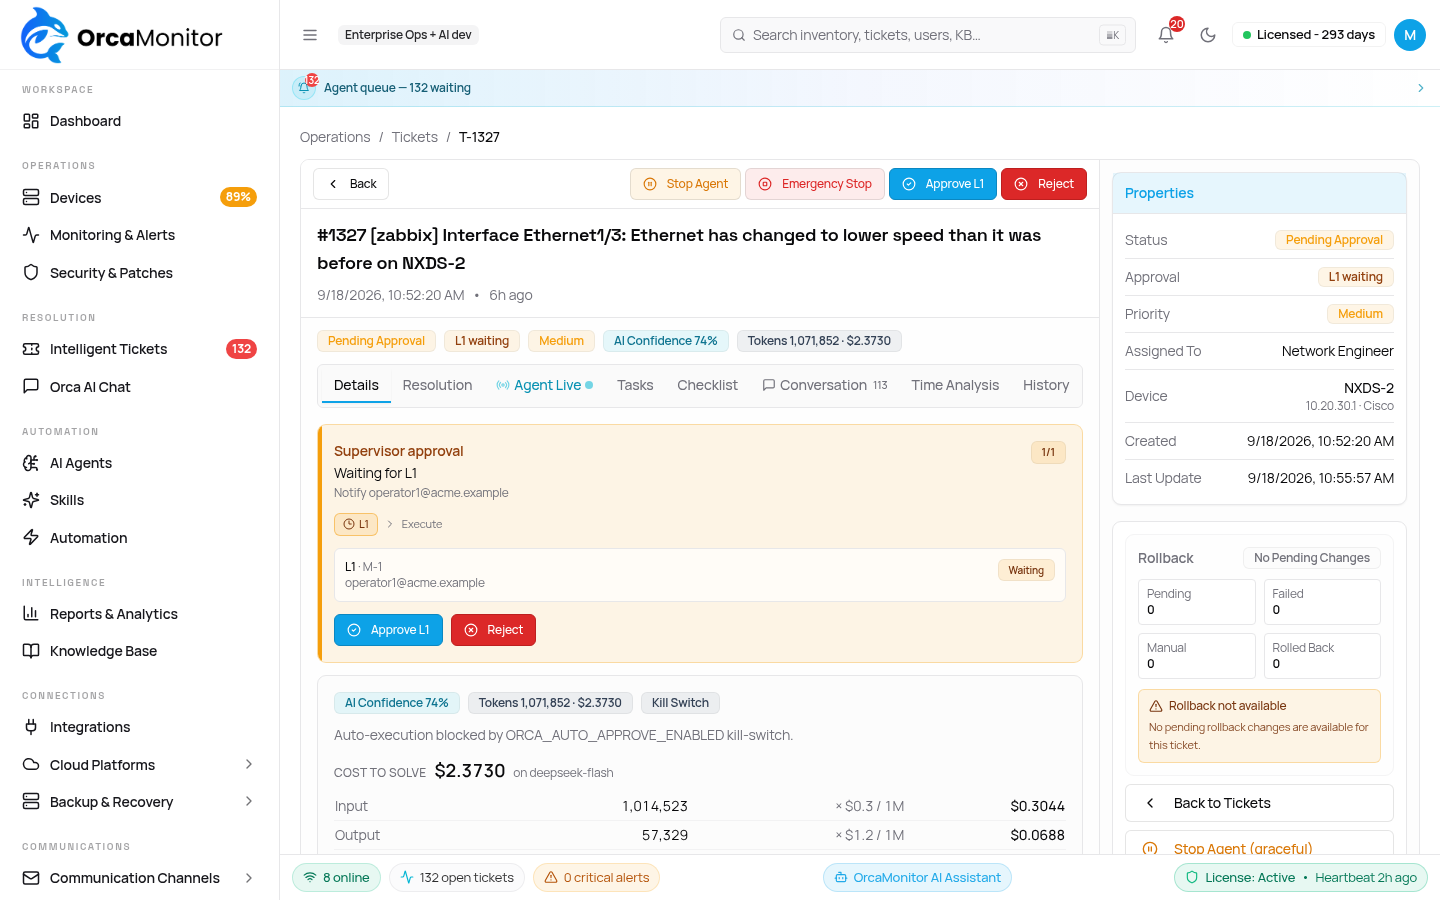
Monitoring & Alerts ingest Zabbix (and other NMS) events. Correlated alerts become Intelligent Tickets. An AI agent writes a plan; nothing runs until Approve on the ticket (L1 → Ln chain from Approval Workflow).
- Ingest opens a ticket and assigns the specialist agent (fit first, load as tie-break).
- Details tab shows the plan, confidence, token cost, and Approve / Reject.
- After the chain is complete, execute uses SSH / Nornir / MCP on the device IP.
- Validate and resolve. Failed tickets that still have a plan can be approved again.
- Orca AI Chat is for questions; mutating changes stay on the ticket.
Route on-prem traffic to cloud
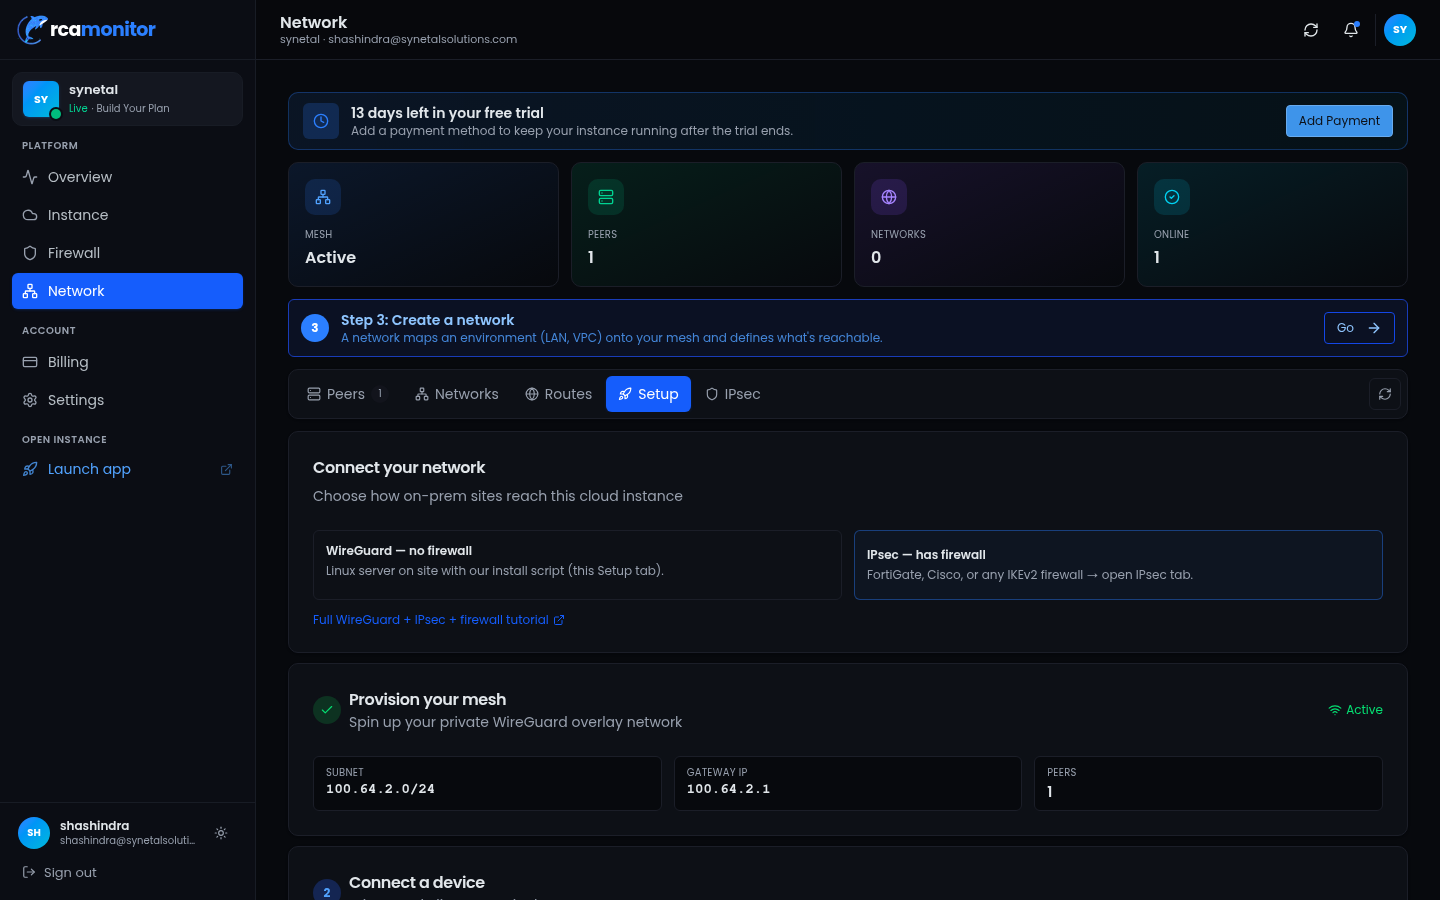
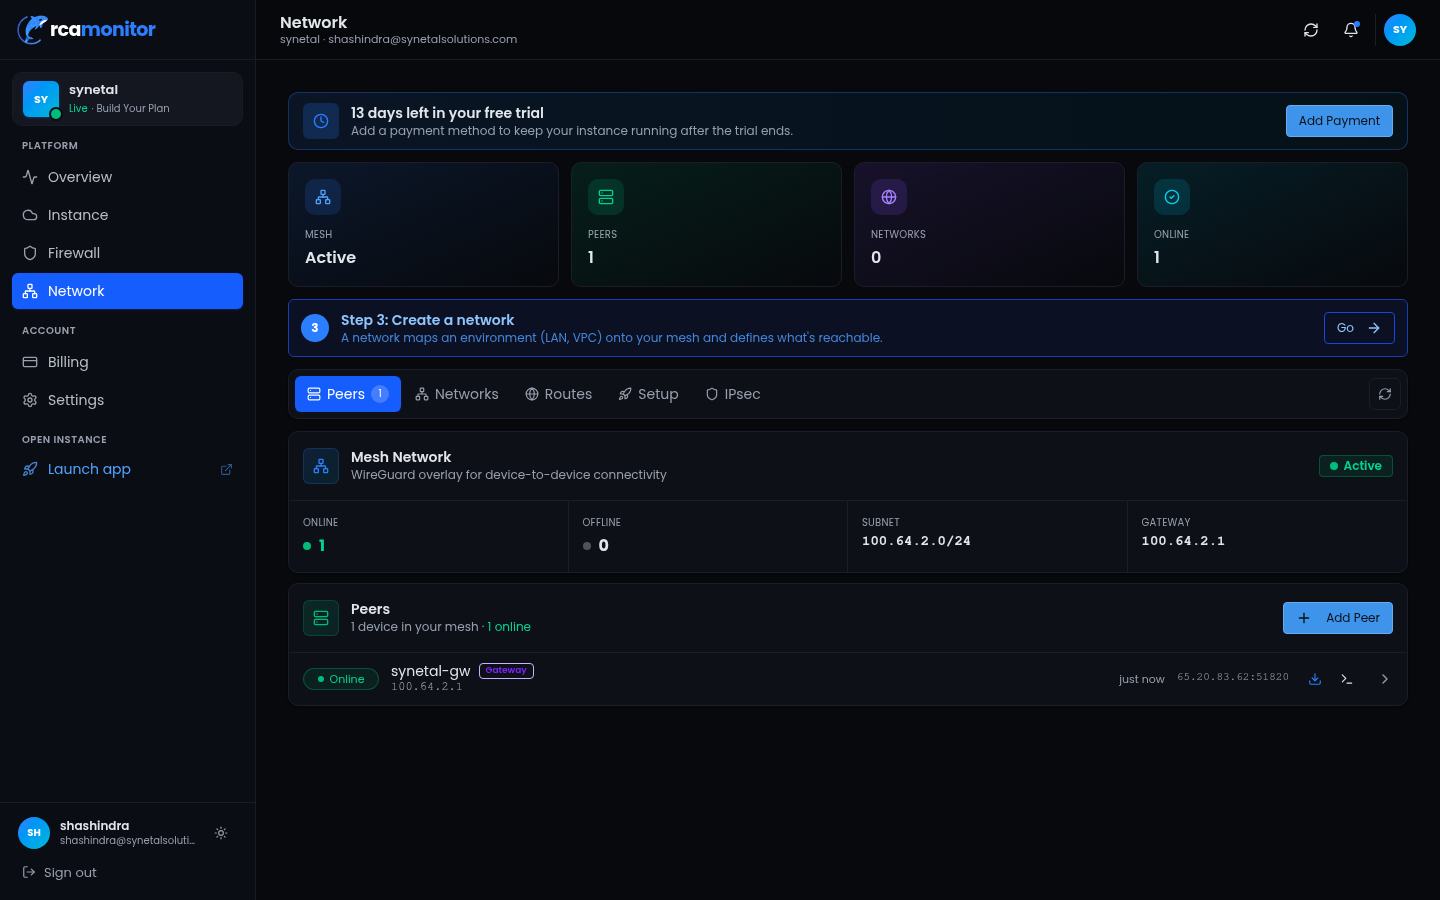
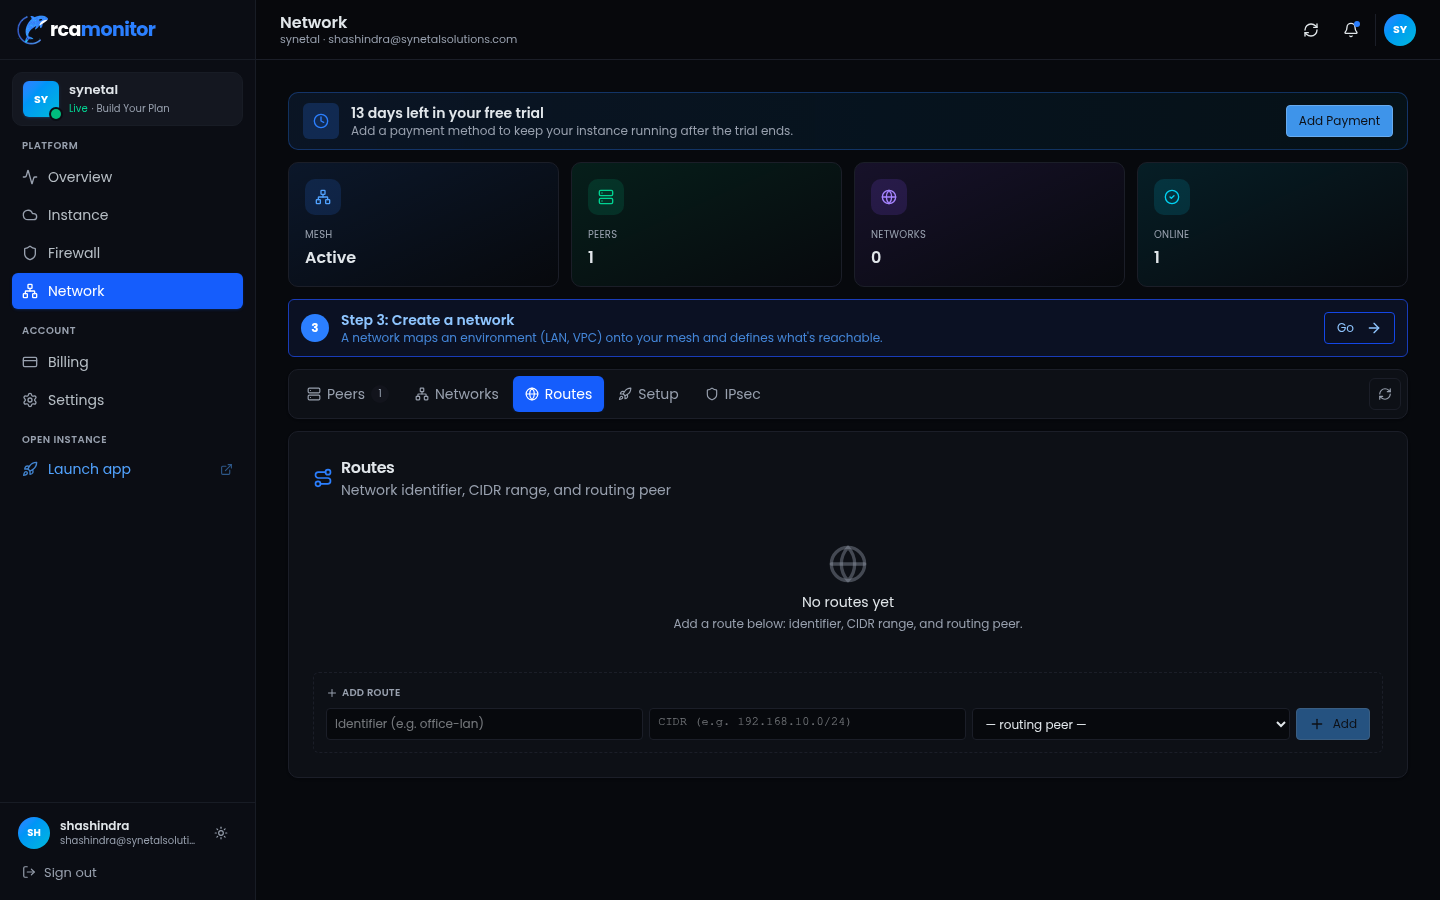
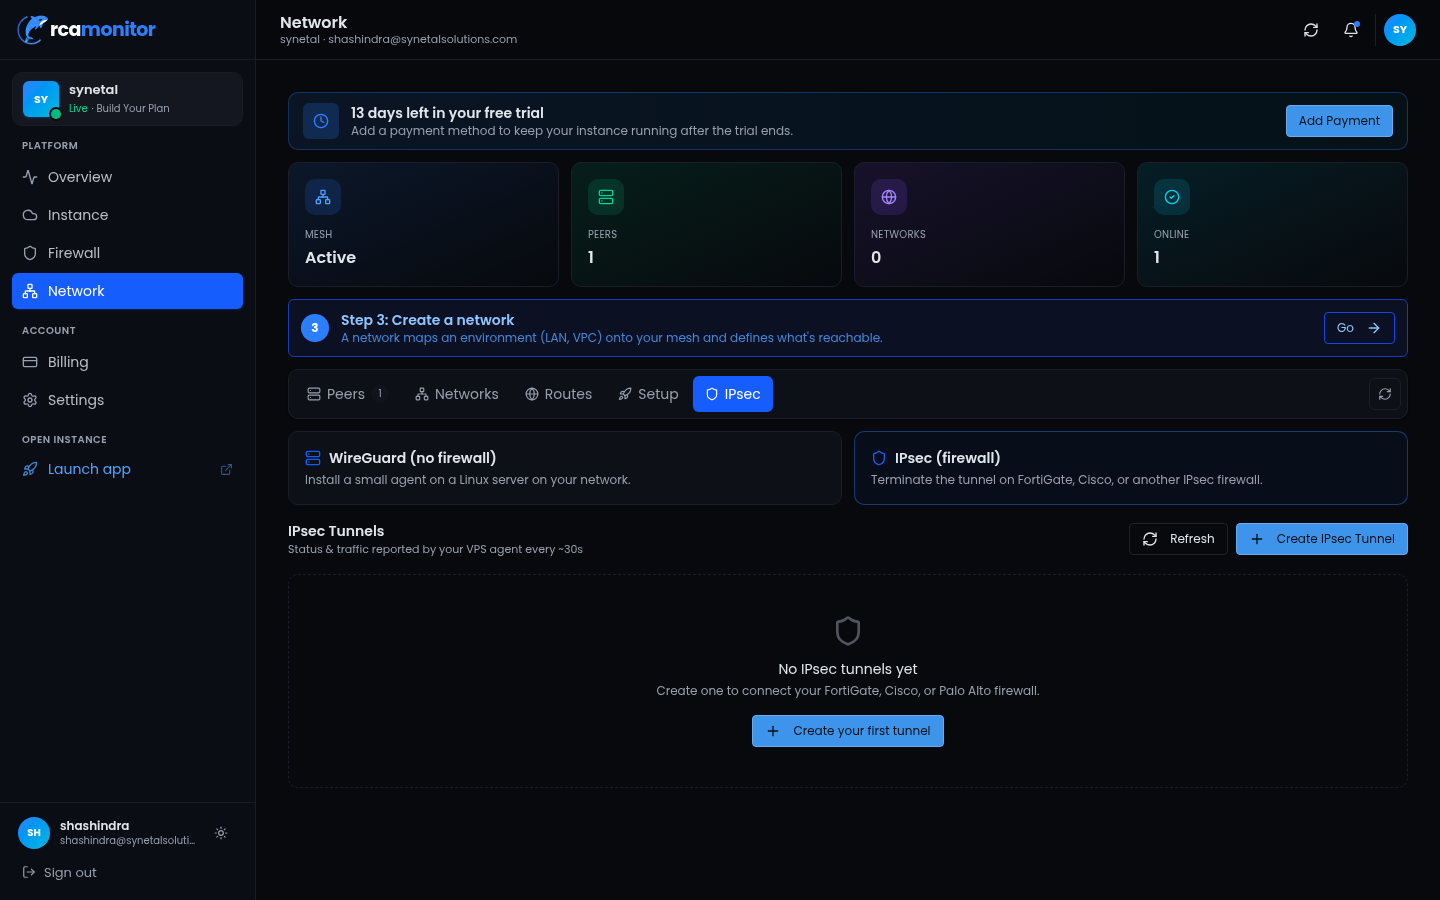
Configure this in the cloud console: Dashboard → Network. Not inside the instance. Pick WireGuard when a Linux host can dial out, or IPsec when the edge firewall already terminates VPN.
WireGuard — no inbound LAN firewall
- Network → Peers → Provision Now (once). Overlay 100.64.0.0/10, UDP 51820.
- Copy the install curl onto a Linux gateway. Token is single-use.
- Peers shows the host online with an overlay IP.
- Routes → Add route: LAN CIDR (e.g. 192.168.101.0/24) via that peer.
IPsec — terminate on the firewall
- Network → IPsec → Create tunnel. IKEv2 + generated PSK.
- Remote = your LAN CIDR. Local = auto /30 in 100.65.x.x.
- Compatible: AES-256-CBC / SHA256 / DH14. NAT-T UDP 4500.
- Create & Apply to VPS, paste values into FortiGate / Cisco / Palo Alto. Wait for Up.
Dashboard → Firewall is the VPS allow-list (typically TCP 443). It is not the VPN. If the tool UI is blocked from the office, whitelist that public IP here. Port 22 is reserved.
Walkthrough
End to end from first login to a ticket on an on-prem device.
Create an account or log in at orcamonitor.ai/login with your tenant email.
Overview shows the cloud instance as Ready, with your subdomain.
Network → Peers: WireGuard install script + route, or IPsec on the firewall.
Firewall: whitelist your public IP on TCP 443 if the instance is not world-open.
Second login on <subdomain>.orcamonitor.ai — this is orcamonitor-tool.
CMDB on the private CIDR, NMS webhooks, approve the agent plan.
System requirements
- Browser: current Chrome, Edge, Firefox, or Safari
- Cloud console: tenant login at /login, deployment Ready, admin for Network
- Instance: operator account on the subdomain, active license
- WireGuard: Linux sudo host, outbound UDP 51820, LAN CIDR not overlapping 100.64.0.0/10
- IPsec: firewall admin, WAN UDP 500/4500, Compatible proposals
Ports
| Use | Port |
|---|---|
| Console / instance UI | TCP 443 |
| WireGuard | UDP 51820 |
| IPsec IKE / NAT-T | UDP 500 / 4500 |
| SSH / SNMP to devices | TCP 22 / UDP 161 after route |
Open the cloud console
Log in, provision Network, then Launch app. Use the feature catalog above to find each sidebar module.
See every module, pricing tier, and deployment option on the OrcaMonitor overview.