
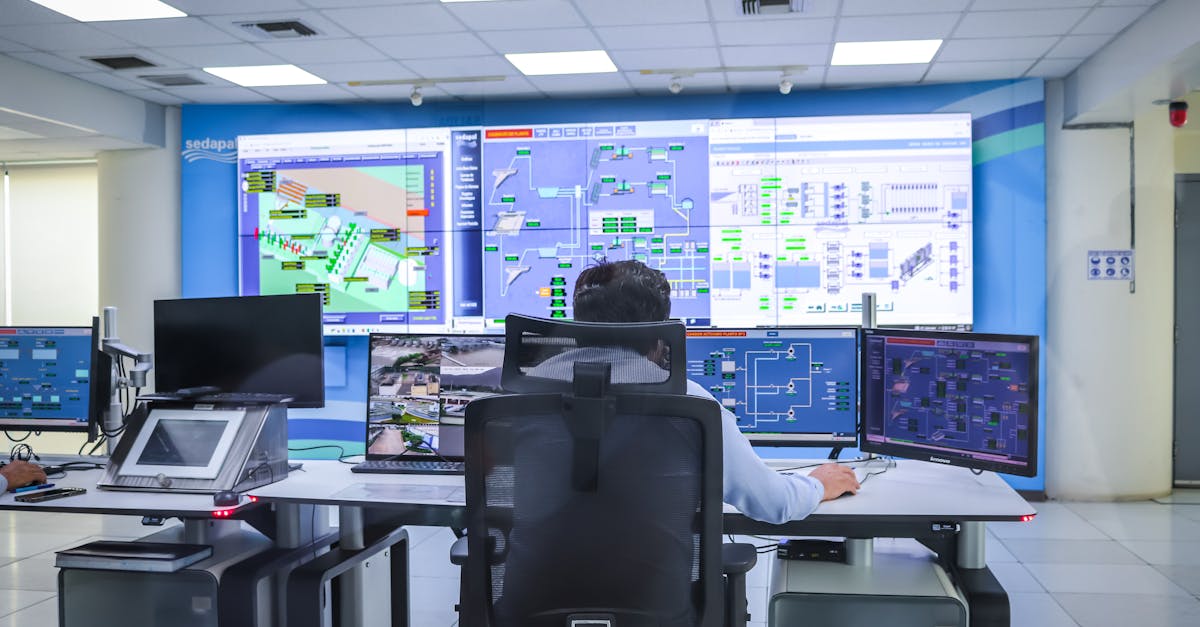
Ask a NOC manager where the mean time to repair actually goes and you will get a story about diagnosis: the tricky BGP flap, the ambiguous packet loss, the vendor bug nobody had seen before. Then you pull the timestamps. Detection at 02:14, first human keystroke at 02:51, ticket closed at 03:40. The heroic debugging session was 12 minutes. The rest was queue.
Most MTTR programs are repair programs. They invest in runbooks, in automation, in better dashboards for the person already working the incident. That is optimizing the shortest segment of the timeline, and it explains why so many auto-remediation rollouts move MTTR by less than the week-to-week noise in the metric.
Break MTTR into five clocks and put a name on each
MTTR is not one measurement. It is a sum of five, and in most NOCs only one of them has an owner:
- Time to detect — the signal fires.
- Time to acknowledge — a human claims the incident.
- Time to diagnose — someone forms a correct hypothesis.
- Time to remediate — the change that restores service.
- Time to verify — confidence that it is actually fixed.
Pull your last fifty P1 tickets and compute each interval from the timestamps already sitting in your incident tool. The pattern most teams find is uncomfortable: 60–75% of elapsed time lives in clocks two and three, acknowledge and diagnose, and both are owned by nobody in particular. Remediation — the phase that gets the tooling budget — is typically a single-digit share. You cannot manage a sum you have only decomposed once, in a meeting, from memory.
The alert queue is the latency, not the network
An engineer cannot acknowledge an alert they have not read, and they cannot read an alert while eleven others are screaming. Do the arithmetic on your own rotation: a NOC clearing 200 alerts across a nine-person shift is asking roughly 22 alerts per engineer per day. If context switching costs three minutes per alert before any real work starts, you have spent an hour of every shift on triage overhead alone — before a single packet is inspected.
This is why alert-volume reduction outperforms alert-enrichment almost every time. Enrichment makes each alert better; deduplication and correlation make there be fewer of them. A 40% cut in page volume is a 40% cut in the queue that gates clock two. Teams routinely spend a quarter tuning thresholds and get a larger MTTR move than a quarter spent assembling a runbook library.
Triage is a lookup problem dressed up as a reasoning problem
The first five minutes of most incidents are not analysis. They are the question what changed? — and the answer is usually sitting in a deploy log, a change ticket, or a config push from the last ninety minutes. An engineer who must open four systems to answer it burns eight to twelve minutes per incident, every incident, indefinitely.
The mechanism that fixes this is boring: a 90-minute change-correlation window attached to the incident record. When an alert fires, attach every deploy, config change, and topology event from the preceding 90 minutes, ranked by blast-radius overlap with the affected service. That does not diagnose anything. It removes three of the four places the engineer would have looked, converting a search problem into a comparison.
The cheapest MTTR win in any NOC is not a faster fix, it is deleting the four minutes an engineer spends finding out what changed.
Automate remediation only where the diagnosis is already deterministic
This is where teams get hurt. Auto-remediation applied to ambiguous signals does not shrink MTTR; it adds a rollback step and a second incident. A restart fired against a memory leak caused by a bad deploy buys you twenty minutes and returns the same alert with less headroom.
The gate should be empirical, not aspirational. Automate a runbook only when:
- It has been executed manually at least five times with the same first three diagnostic steps.
- The trigger condition can be evaluated from telemetry alone, with no human judgment in the branch.
- The action is reversible in under two minutes, and the reversal is automated too.
- The failure mode it addresses accounts for a meaningful share of page volume — not an interesting edge case.
Everything else belongs in a suggested-action queue, where the platform proposes and the engineer confirms. That hybrid still clips minutes off clock four without importing the risk that makes operators distrust automation for the next two years.
Verification is where trust is spent
Closing early feels like an MTTR win and is usually a deferred cost: reopen rate climbs, the same incident gets a second ticket number, and the metric improves while the customer experience does not. Track 24-hour reopen rate beside MTTR, and treat any MTTR improvement accompanied by a rising reopen rate as a measurement artifact rather than a result.
Verification automation — a synthetic check against the recovered path, error-budget confirmation over a five-minute window, a topology health assertion — costs minutes, not hours. It is the one place where adding automation to the tail of the timeline reliably helps instead of shifting work around.
Where this is heading: MTTR becomes a streaming SLO
The NOC is converging on the shape of a data platform. Alerts become a stream, triage becomes enrichment, and the metric that matters stops being how long did the repair take and becomes time to first correct hypothesis — how long from signal to a ranked, evidence-backed explanation an engineer can act on. Teams that instrument that interval will find the bulk of the remaining win sits upstream of the terminal, in correlation, deduplication, and change context. Teams that keep buying repair tooling will keep celebrating a 6% improvement and wondering why the pager never gets quieter.